Tuesday, April 21, 2015

So how much does it cost to build a robot?

Gabe O’Neal
Mrs. Straub
Economics
April 21, 2015
So how much does it cost to build a robot?
Short Answer: $18,245.11
Long Answer:
FIRST Robotics Team 1259, Paradigm Shift, is based here at Pewaukee High. What you probably didn’t know is just how much money flows through our team each year. Let’s take a look at the 2015 season expenses and income for the team.
Our robot is actually only allowed to cost $4000 max. We have to keep track of all the parts we’ve ordered and materials used to build the robot and make a Bill Of Materials (BOM) for the judges at the competition. This year, our robot came out to about $3500. But in reality, it cost more than just the materials and components we bought for it. It cost time, food, effort, and fees. That’s where the $18,254.11 comes from.
Here’s a breakdown of the expenses for our team in 2015.
Expense
Budget
Actual
Regional $ Championship Registration Fees & KOP (Kit of Parts)
$9,000.00
$5,125.00
Robot Supplies
$8,000.00
$8,454.81
Tools and Other Supplies
$4,405.88
$1,398.31
Shipping Charges
$74.76
$39.00
Team Meals
$0.00
$380.86
Spirit Supplies and T-Shirts
$2,953.62
$2,383.66
Regional Mentor Hotel Rooms
$2,801.61
$0.00
Off-season Programs
$2,300.00
$18.47
End of season banquet/Mentor Gifts
$400.00
$0.00
Miscellaneous
$350.00
$445.00
TOTAL EXPENSES (Team only)
$30,285.87
$18,245.11
Regional $ Champion Registration Fees and Kit of Parts includes the money we have to pay to compete at the regionals we attend (the Wisconsin Regional was the only official regional we attended this year) and it also includes money we pay as a team to be a team and receive the Kit of Parts from FIRST. The KOP is a bunch of components and wheels and miscellaneous items that every team gets each year. The KOP changes from year to year with the game.
Robot Supplies includes materials, components, and anything else we paid for that became part of the robot. We built two robots this year so we could have one for practice. We also did not end up using everything we bought. That’s why the total is over $4000 for robot supplies.
Food comes into play in the Team Meals section. We have lunch as a team on Saturdays during the build season and that is paid for with money we raise.
Some sections have not been fully updated yet. We actually just had our banquet and the business team has not met yet to be able to calculate the actual expenses for the banquet and mentor gifts.
So where does all that money come from?
Income
Budget
Actual
Sponsor Donations
$29,770.00
$19,399.38
Income - Other Student Dues $90 per student
$2,380.00
$1,925.00
Income - Other Concessions/50-50 - Booster Club
$2,162.13
$2,126.84
Income - Other Miscellaneous
$883.59
$2,081.69


TOTAL INCOME (Team only)
$35,195.72
$25,532.91
The bulk of our income is from Sponsor donations. We are sponsored by many local businesses and our top sponsor gives us $5000.
We fundraise year round and make trips to our sponsors’ sites to demo the robot and give them a presentation about where their money is going. We have a program called 100x100. Team members travel around Pewaukee and try to get 100 businesses to donate $100 each.
This year, we started the season with $5,935.34 left over from last year. The rollover and income might look like a lot, but as a team, we became worried when we lost some major sponsors.
With a budget and business meetings, our team is managed as a not-for-profit business.
Unlike a free market economy, sometimes we are told what to buy or who to buy it from. This is important in ensuring that teams around the world have a standard component . These are also elastic goods because no matter what they cost, we will buy them so that we are able to compete.
There are times in the season when parts go out of stock. Our robot this year had mecanum wheels. These wheels have rollers at 45 degree angles and, when 4 wheels are arranged in a certain orientation, the robot can drive not only forward and backward, but it can strafe left and right as well. For a while, these wheels were scarce. Demand for these wheels went way up when we heard about the game this year. Since only one manufacturer made the wheels that most teams wanted, they went out of stock for a period of time. This shortage made teams’ demand even higher, as each team wanted to be the first to order their wheels as soon as AndyMark got them in stock.
am-0732-2T.jpg
If our robot were to count into America’s GDP, we would have to make sure not to count all the individual parts, but the value of the robot itself. We could also add up all the other robots that were produced this year by teams in the U.S.
Income distribution between teams in the U.S. is very noticeable. Teams with more money have access to better technology, can go to more competitions, and can fund many off-season events. In the world of FIRST, it’s obvious what teams have more money than others, even if you don’t know the exact numbers.  This is caused by where the teams live and what sponsors they can get to sponsor them . Take team 118 for example. The Robonauts are sponsored by NASA. https://www.youtube.com/watch?v=C-fA0YxxvnU
FIRST isn’t all about building robots. There is a whole business and economic side to it. Danny Ketterman led our business team this year and last year and it will be tough next year without him. His experience with FIRST has prompted him to study economics and business in college.
So now when people hear how much money our team raises and spends, I hope they have more of an understanding of what is all required to build a robot.
Works Cited
6" Mecanum Wheels. Digital image. AndyMark. AndyMark, n.d. Web. 21 Apr. 2015.

Ridley, Justin. "Team 118 Robonauts 2015." YouTube. YouTube, 18 Feb. 2015. Web. 21 Apr. 2015.

Thursday, April 16, 2015

A New Arena for the Milwaukee Bucks

A New Arena for the Milwaukee Bucks
by Madeline Collins

Milwaukee Bucks fans have been thoroughly excited by the news of the development of a state-of-the-art arena for the team, accompanied by an open-air entertainment center. This is not only big news for the team, but it is influential for local businesses and taxpayers as well. $500 million is the grand total for the construction of this arena, and everyone is eager to know where this money will be coming from.
Governor Scott Walker has answered the call by developing a plan called the “Pay Their Way” proposal. While the Bucks’ owners are providing at least $150 million, state bonds worth $220 million will be added in, as well as $100 million pledged from former owner Sen. Herb Kohl, causing the total to be $470 million. The cost of a new arena will be about $500 million. See this article to learn more about Walker’s proposal.
www.beinsports.tv
The money still needed to put this plan underway has induced talk among the public and the remaining owners of the Milwaukee Bucks. Many fans agree that the owners should be putting forth a significant portion of the cost. Co-owner Wes Edens commented on the public’s demand for further financing stating, “There is an economic side to it, and it has to be a viable transaction.” Edens elaborated, affirming the owners’ existing financial commitment “kind of pushes the limit” on that viability. Even so, he confirmed that the wealth of the owners “complicates the narrative.” Watch this video for coverage on “The Economics of a New Arena” and how the public has reacted to the resulting cost of this notion.
It is relatively simple to see that the manifestation of this exciting idea is not exactly a quick and easy decision. Even with Scott Walker’s proposed “jox tax” that appears to lessen the trade-offs involved in constructing the arena, there are surprisingly many negative externalities that will likely evolve. While proponents claim that a new arena and surrounding area will help economic growth, increase the employment rate, and increase the Bucks’ revenue, these are actually common false predictions. The new public space replacing the area where the Bradley Center currently is may provide a surplus of restaurants and/or entertainment, causing the surrounding facilities to lose business. Consumers’ discretionary income is limited, and they only have so much money set aside to play with for things that are a couple of hours of fun and then done. This means other entertainment businesses, like movie theaters, could lose revenue because consumers’ money will be placed elsewhere.


www.bucksketball.com
When it comes down to deciding whether or not the arena and surrounding public space is truly worth the cost, the answer depends on our intentions. If we claim that we’re doing it for the economic benefit, then it is not a viable solution; economic growth is not going to be enormous, and the employment rate will not likely skyrocket if other businesses struggle as a result. Long lasting positive effects -- at least not drastic ones -- will not occur unless exports are induced: people from outside of Milwaukee who would not otherwise spend money on the Bucks. However, if we claim that we are doing it to improve the overall quality of life for the team and the fans, then yes, this is a viable solution. If we truly enjoy a night out filled with basketball and good food and drink, then let the construction begin.


Works Cited
"Bucks Announce Game-changing $1 Billion Arena Package." Bucks Announce Game-changing $1 Billion Arena Package. 11 Apr. 2015. Web. 12 Apr. 2015.
"THE ECONOMICS OF A NEW ARENA." YouTube. YouTube. Web. 12 Apr. 2015.   
"Walker Proposes Investment of $220 Million for Arena." Walker Proposes Investment of $220 Million for Bucks Arena. 11 Apr. 2015. Web. 12 Apr. 2015.  


Improvements in Technology

Ally Mitchell
Economics
4/13/15

The constant demand for improvements and advances in technology has caused a huge market to pop up to provide all of the items that aren’t necessarily needed, but are badly wanted by the public. Our society teaches us not to be content with what we have, but to always push towards attaining whatever the newest, best product is that’s being produced. This is both a blessing and a curse for the companies that produce the equipment we rabidly buy up because they can make a lot of money with each new product they release, but they can’t ever just sit back and let their product sell. They must constantly be meeting the demands for better products, and they have to be able to supply these better products in order to remain relevant so that they can continue turning a profit.
In this day and age that seems to be run by technology, we are all aware of how quickly technology grows old, and Ian Hamilton puts it well when he says, “with technology, the only constant is change.” Take Apple for example, just when the hype over the latest iPhone has died down, a new one is suddenly introduced to the consumer market. Although there is nothing wrong with their iPhone 5, consumers will rush to the store to buy the iPhone 6, which is good for Apple because of the revenue they bring in, but bad for your wallet in the long run (how different is the iPhone 6 from the iPhone 5 anyways?)

iphone.jpg

Just as all the previous versions of the iPhone are out-of-style and out-of-date, there are a list of other items that are projected to become obsolete in the near future. In his article “5 Tech Products That Will Be Dead in 5 Years”, Micah Singleton predicts that DVD players, stand alone in-car GPS units, dial-up internet, low-end digital cameras, and car keys will no longer be around. All of these disappearances would be due to the fact that advancements in technology replace them. Who would feel the need to own a DVD player if all of their movies can be streamed on Netflix or if they can buy them on iTunes? Who would need to buy a low-end digital camera when their phone can take equally good if not better pictures? Who would want to waste money on inelastic goods that can be replaced by better supplement goods?

graph.gif
As you can see in the graph above, the amount of music in general that is being purchased has seen a sharp decrease. While consumers are buying less CDs, they are investing more in digital downloads, which only came about in recent years. As with the extinction of DVD players, it’s not unlikely that CDs won’t disappear as well with the rate we are moving towards digitizing everything. Hamilton brings up an interesting subject when he says that physical objects give us a sense of nostalgia that their digital equivalents just can’t drum up. For instance, “Parents might keep forever the books they read to their children, but probably wouldn't keep the digital file or a Kindle they used to read to their child” (Hamilton). This makes sense, but I’m not sure that nostalgia is powerful enough to slow down the mark that technology is leaving on us.


Hamilton, Ian. "With Technology, the Only Constant Is Change." The Orange County Register. 12 May 2011. Web. 13 Apr. 2015.  

Singleton, Micah. "5 Tech Products That Will Be Dead in 5 Years." - Techlicious. 30 Dec. 2013. Web. 13 Apr. 2015.

The Surprising Truth of Easter Sales

The Surprising Truth of Easter Sales
Alex Baker
Mr. Reuter
Economics
April 14th, 2015
The Surprising Truth of Easter Sales
Many people enjoy the holiday of Easter. Everyone gets the candy they love and they can sit around and eat all the candy they love, but why is it that Easter candy sales are almost higher than any holiday? Easter Candy sales are higher than most other holidays, like Christmas, but just lower than the holiday of Halloween?
Most children from all around love waking up Easter morning and hunting for their Easter basket that the Easter bunny hid around the house the night before, but what they don’t know is that Easter sells over 2.26 billion dollars worth of candy during this holiday. Chocolate and jelly beans have such a high demand for people during this Easter holiday. Within the Easter holidays the supply of candy is tons. Stores are making over 700 million peeps because, the United States will consume about 700 million peeps.
Why is that candy sales are just below the amount consumed during Halloween? That is because, about 87% of families will celebrate Easter and all of them will try and at least get their children some kind of candy on Easter morning.
Knowing what we do about Easter the given holidays candy companies are bringing in a major amount of revenue because, they are producing the candy that we as people are buying. Candy companies like Nestle or Hershey's are bringing in major money because, just within the candy season we buy 16 billion jelly beans and 83% of parents will buy their children candy for Easter.
Although, candy companies are making the money they need they are not the only company who are making money on the Easter Holiday. Companies who produce toys and crayons and little tiny toys for children to throw in their basket are making money out of this holiday. 73% of parents will include toys in their children Easter baskets.
The shocking truth to children and parents is very surprising because, not many people thought, Easter was the second most candy consumed holiday right behind Halloween because, Halloween is all based upon candy. Many people thought that Christmas would be in front of Easter, but Easter is the second most popular holidays for candy sales and keeping those major companies afloat. Many Easter is all about the candy and the family behind it, but its also a major profit for companies all around. Just within this last easter we brought in over 16.4 billion dollars for total profit of candy and toy sales for the Easter Holiday.
Although, this holiday is about your family and being with the people you love and hunting for your Easter basket and finding those Easter eggs it’s also about the candy companies and the total profit coming in for companies and businesses all over. Its a holiday that companies depend on. It brings in the second most amount of money on candy.


Works Cited
Easter Candy Sales and the Confectionary Supply Chain [Infographic] (Logistical Insights)


Consumers on the Hunt for Candy, New Spring Apparel This Easter (NRF)


National Confectioners Association releases 2014 Easter trends- Press Relases - News & Hot Topics - NCA (National Confectioners Association releases 2014 Easter trends- Press Relases - News & Hot Topics - NCA)

Tuesday, April 14, 2015

Taxes

Matt Lupo
Mrs. Straub
AP Econ
12 April 2015
Taxes
With the tax filing deadline approaching on April 15, taxes seemed like an appropriate – if boring – topic for an economics blog post. Taxes are a vital part of any economy because they provide almost all of the revenue raised by the government [see graph below (Williams)], and this revenue is then used to provide numerous public goods and pay the salaries of government employees, which Mike Patton of Forbes estimates to be about 7% of the population of the United States (Patton). The two main functions of taxes are to fund the government’s operations and to potentially reduce income inequality, but how well does the current tax system accomplish these goals?
The-Numbers-Jan-2012-Fig1
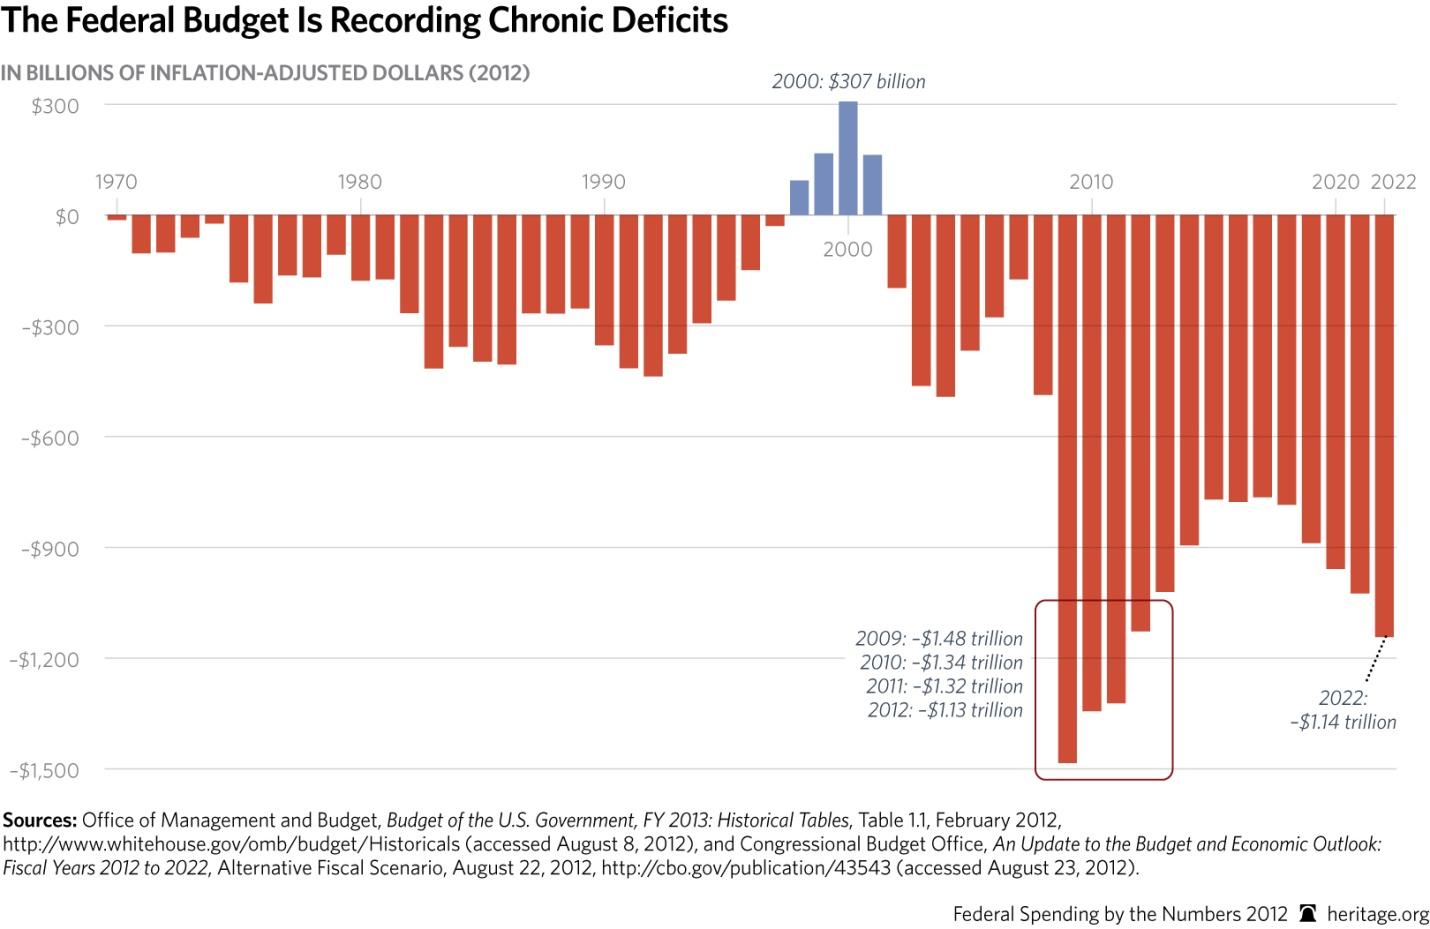
Despite a minor budget surplus that spanned from 1998-2001 (at which time the U.S. entered into a recession), the federal government has run on a deficit for much of the last forty years (Fraser). Seemingly, this would imply that taxes are doing a poor job of funding the federal government, as the revenue raised insufficiently covers the government’s expenditures. However, there are a few factors that must be considered before this judgment can be accepted. Most importantly, we must evaluate the context of the deficits and the underlying economic theory behind these deficits. During the drastic spike in deficit spending, highlighted on the graph below (Fraser) as the period from 2009-2012, the United States was recovering from a recession. According to the popular Keynesian theory, changes in aggregate demand can be used to counter the effects of a recession (Jahan, Mahmud and Papageorgiou). In order to change the aggregate demand, the government must implement an expansionary fiscal policy, which can be achieved through either a reduction in taxes to spur consumer spending or through an increase in government spending. Since both of these factors – consumer and government spending – are components of the GDP, raising either or both of these components would increase output and decrease unemployment, hopefully closing the recessionary gap. With this in mind, although the tax revenue does not adequately cover the expenditures of the U.S. government, deficit spending is necessary to accomplish the economic growth desired by fiscal policy.
An opposing theory, however, is less supportive of governmental tax policy. Supply-side economics, which focuses on the factors of production that determine the amount of goods supplied, explains the desired tax rate with the Laffer curve (Moore), which is illustrated below:
Simply, the Laffer curve illustrates the relationship between the tax rate and the amount of tax collected by the government. After increasing with the tax rate, the amount of tax revenue reaches a peak and then decreases with further increases in the tax rate. There are two sets of points of note on the graph; at a tax rate of 0% and 100%, the government will collect no tax revenue. If it does not impose a tax rate, the government obviously cannot raise tax money, and  if there is a 100% tax rate, there will be no incentive for anyone to work, thus also eliminating tax revenues. The other points of note are the hypothetical 20% and 80% points, which have the same tax revenue. Since the curve slopes upward and then downward, there are infinite amounts of two coinciding points along the curve that have the same amount of tax revenue. Supply-side economists argue that if the government imposes a tax rate somewhere in the downward-sloping section of the Laffer curve, taxes are funding the government inefficiently, since the same revenue could be acquired with a lower tax rate. In this way, taxes would be more inefficient than they need to be.
Finally, the tax system can be used to even the inequality of income distribution. A video produced by the Brookings Institute outlines the pre- and post-tax income distribution in the U.S., and while income is unevenly distributed, taxes do make some difference in leveling the playing field (Wessel). As a whole, the U.S. tax system is slightly progressive, but individual taxes, especially sales tax, are regressive. Since a greater percentage of the lowest earners’ income is exposed to sales tax, it is considered regressive (Chinni). Accordingly, redistribution of wealth through taxes does some damage to income inequality, but its effects are limited. The topic of income inequality is complex, so if you are interested in learning more about where in the U.S. income inequality is the most prevalent, the importance of income mobility, or the ability of education to combat income inequality, click the links.
Overall, the effectiveness of taxes is a subjective matter. Some view more taxes as a better policy, while others favor lower tax rates. Taxes can reduce income inequality, but they can also subject the lower earners to higher effective tax rates.
Works Cited
Chinni, Dante. "The Geography and Politics of Taxes." 12 April 2015. NBC News. 12 April 2015 <http://www.nbcnews.com/meet-the-press/geography-politics-taxes-n340101>.
Cowen, Tyler. "It’s Not the Inequality; It’s the Immobility." 3 April 2015. The New York Times. 12 April 2015 <http://www.nytimes.com/2015/04/05/upshot/its-not-the-inequality-its-the-immobility.html?abt=0002&abg=1>.
Fraser, Alison. "Federal Spending by the Numbers - 2012." 16 October 2012. The Heritage Foundation. 12 April 2015 <http://www.heritage.org/research/reports/2012/10/federal-spending-by-the-numbers-2012>.
Jahan, Sarwat, Ahmed Saber Mahmud and Chris Papageorgiou. "What is Keynesian Economics?" Back to Basics September 2014.
Moore, Stephen. "The Laffer Curve turns 40: the legacy of a controversial idea." 26 December 2014. The Washington Post. The Washington Post. 12 April 2015 <http://www.washingtonpost.com/opinions/the-laffer-curve-at-40-still-looks-good/2014/12/26/4cded164-853d-11e4-a702-fa31ff4ae98e_story.html>.
Patton, Mike. "The Growth Of Government: 1980 To 2012." 24 January 2013. Forbes. 12 April 2015 <http://www.forbes.com/sites/mikepatton/2013/01/24/the-growth-of-the-federal-government-1980-to-2012/>.
The Economist. "Tax revenue." 13 December 2014. The Economist. 12 April 2015 <http://www.economist.com/news/economic-and-financial-indicators/21636056-tax-revenue?zid=293&ah=e50f636873b42369614615ba3c16df4a>.
Wessel, David. "Does the Tax System Reduce Inequality?" 12 April 2015. Newsweek. 12 April 2015 <http://www.newsweek.com/does-tax-system-reduce-inequality-321556>.
Williams, Roberton. The Numbers: What are the federal government’s sources of revenue? 13 September 2011. 12 April 2015 <http://www.taxpolicycenter.org/briefing-book/background/numbers/revenue.cfm>.
Related Posts Plugin for WordPress, Blogger...