Wednesday, February 28, 2018

Cape Town Water Crisis

Cape Town Water Crisis - Kat Van Hulle


South Africa’s second largest city, Cape Town, has been caught up in an ongoing water drought for the last three years. Cape Town is now fast approaching “Day Zero”, the estimated date when the city is due to run out of water completely. Day Zero was initially declared as April 16, 2018 but has recently been pushed back to July 9. Nonetheless, citizens of the region are now more than ever feeling the impending stress of what will happen once Day Zero arrives. If Cape Town’s water consumption problem doesn’t lessen within the next few crucial months, South Africa will be facing economic implications in both the short run and long run for decades to come.


As of now, Cape Town’s nearly 4 million inhabitants have been restricted to 50 liters of water per day. In comparison, per capita water use per day in the United States averages around 101.5 gallons, approximately 385 liters. Once Day Zero hits though, South Africans will be allowed only 25 liters each day, and be forced to collect the water at one of the 200 public distribution locations since all taps will be turned off. With extremely limited access to water, how will the city of Cape Town be affected, specifically their previously booming property and tourist market?

Consumer expectations about the state of Cape Town has shifted as citizens begin to brace themselves for the severity of Day Zero. While one may think that the drought leave residencies abandoned and tons of buildings up for sale, Cape Town’s property market will actually experience an increase in demand. Since the outlying rural and agricultural areas of Cape Town will be hit hardest by a lack of water, an influx of these workers will be looking for affordable housing rentals in town, subsequently pushing up price levels on the limited supply. As nominal wages drop, workers will seek job opportunities in other places, and need cheaper residency. Once wages fall, individuals’ marginal propensity to consume decreases and their marginal propensity to save increases. Far fewer developments will be built, further exacerbating the minimal supply of property for unemployed farmers and driving up the price level which could be an issue in the short run.

In addition to the housing market, revenue generated by tourism that would have significantly boosted the country’s GDP will likely be stifled by the water crisis too. The picturesque beaches and grand mountain views are what draw tourists to Cape Town, and the industry has adjusted to accommodate foreign travelers by building hundreds of hotels and resorts. City officials are questioning whether tourists should be allowed in at this time, or if they should try to save the travel industry that contributes about 10% of South Africa’s annual GDP. In some areas, “B&Bs and hotels have now been given an extra dispensation to use municipal water in a bid to keep the tourist industry alive, but all guests are asked to be as careful as possible” (Twigg). In my opinion, the resource market needs to be addressed first before Cape Town starts to worry about tourism. The water and resultant agricultural problems should be the main priority to ensure the longevity of the city before civilians start to flee and tourists won’t be interested in complying with water restrictions.

*Click here for interactive graphs/charts illustrating the Cape Town water crisis

Bibliography:
Lee, Tracy. “What is 'Day Zero'? Cape Town set to become first major city to run out of water.” Newsweek, 29 Jan. 2018, www.newsweek.com/day-zero-drought-cape-town-792036.

Scott, Michon. “Day Zero Approaches in Cape Town.” NOAA Climate.Gov, 7 Feb. 2018, www.climate.gov/news-features/event-tracker/day-zero-approaches-cape-town.

Twigg in Cape Town, Melissa. “Cape Town drought: How locals and tourists are being affected.” The Independent, Independent Digital News and Media, 30 Jan. 2018, www.independent.co.uk/travel/africa/cape-town-drought-latest-updates-local-south-africa-tourists-effects-travel-holidays-business-a8185166.html.

Tuesday, February 27, 2018

Adidas Back in the Game

Adidas Back in the Game
Thomas Knoke

Adidas, founded by Adi Dassler, is a sportswear company that designs and manufactures shoes, clothing and other accessories sold in multiple nations. The brand started becoming bigger when founder Adi Dassler persuaded Jesse Owens to wear his hand crafter track shoes in the 1936 Summer Olympics. After Owens came home with four gold medals, people were all over those shoes. The name Adidas was put into play in 1949 and since then has taken off. It is the largest sportswear company in Europe and second largest in the world, right behind Nike.
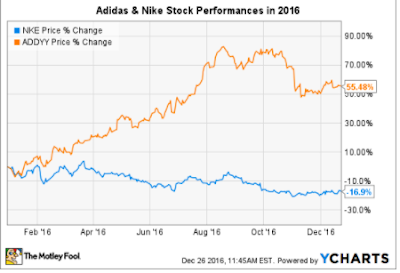
Although Adidas is the second largest sportswear company in the world, that doesn’t mean they don’t have to compete because oftentimes society changes their tastes, expectations and preferences all the time. For a while Adidas was dominating the sportswear industry, but in 1964, when Nike came into play, it wasn’t all that easy for Adidas. People quickly changed over to Nike products and suddenly Adidas had their new biggest rival. Demand was increasing for Nike like crazy and that’s all people wanted. But just recently, people have started to wear more Adidas again because of their new arrivals. Adidas figured out a way to become both a sportswear brand and a hypebeast brand. Adidas fund something that they could do that Nike would never expect so that they could increasing
demand of their product and it was working well. Adidas developed the strategy of giving their products to celebrities for people all over the world to see on social media, television and even in concert. For example, shortly after Kanye West was in contact with Adidas, they developed the Yeezy shoe. This shoe, part of the hypebeast category, was a $1000 shoe and people bought it without hesitation just because Kanye wears it, It’s crazy how something like that works. Even going back to the Jesse Owens example I used before, when you put a celebrity in your product, people want to buy it just because they’re wearing it. Focusing back on the topic, when Adidas finally started partnering with news breaking celebrities, output has increased tremendously and Adidas is making a huge comeback from its rougher years in the early 10’s. Their profitability is getting way closer to Nike’s and the overall value of their company is increasing.
In conclusion, Adidas had many ups and downs on their mission to become the number sportswear manufacturer in the world. They quickly figured out that they can’t just continue doing the same things, they had to think outside of the box and put their product of celebrities that the public was constantly relating to and watching. The point is, Adidas is a on comeback and their future is still very bright. Now the only question is....  Nike or Adidas?


Works Cited
“Adidas.” Wikipedia, Wikimedia Foundation, 25 Feb. 2018, en.wikipedia.org/wiki/Adidas.

Rains, Benjamin. “The Rise and Future of Adidas.” Zacks Investment Research, Zacks Investment Research, 26 Feb. 2018, www.zacks.com/stock/news/287528/the-rise-and-future-of-adidas.

Ricadela, Aaron. “How Adidas Got Back in the Game.” Bloomberg.com, Bloomberg, 29 Sept. 2016, www.bloomberg.com/news/articles/2016-09-29/how-adidas-got-back-in-the-game.

Tonner, Andrew. “Better Buy: NIKE, Inc. vs. Adidas.” The Motley Fool, The Motley Fool, 28 Dec. 2016, www.fool.com/investing/2016/12/28/better-buy-nike-inc-vs-adidas.aspx.

The National Debt

The National Debt
Written by: Nicole Holzhauer

Recently in AP Economics we have been talking a lot about our national debt. My peers and I had a ton of questions about it and so I thought it would be a perfect topic to research for my blog. Just to give you an idea of how bad our debt is check out this link: (http://www.usdebtclock.org/). It is hard to comprehend how huge our national debt is because it is constantly increasing. America’s debt is the largest that exists for a single country. The debt is now greater than what we can produce in an entire year known as the gross domestic product.

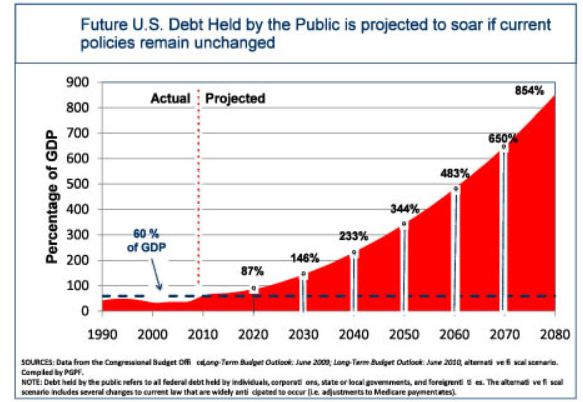
Here is a graph that was made in 2010 that projected 2020’s debt to be about 87% of GDP, but here we are today in 2018 looking back at 2017 when the national debt was equivalent to about 105.40% of GDP. The amount this number has increased is very concerning for the United States. In 1988, the national debt was only 50% of GDP. So how did this number get so big?

According to “The Balance”, there are several main reasons why our debt got so large. First, the debt can be attributed to federal budget deficits which occur when expenditures exceed total revenue. Second, presidents borrow from the Social Security Trust Fund which makes their deficits look smaller, but the real amount owed still shows up in our debt. Basically, our government owes itself. Third, the government keeps interests rates low and fourth, Congress increased the debt ceiling after it started getting hard to maintain. As for the short run, we benefit from the deficit spending of the government. We need defense equipment, new construction, health care, and much more that contributes to GDP. As for the long run, things do not look as great. If the Social Security Trust Fund does not cover retirement benefits for the baby boomer population, taxes will most likely increase to make up for it, or they will cut out on promised benefits for people.

I bet you’re wondering how we are going to decrease this debt. The first way, which may seem obvious is to cut spending. The only problem with this is it would slow economic growth and decrease GDP. As we know GDP is consumer spending + investments + government spending + exports - imports. A key part of that equation is government spending. Next, the government could raise taxes, but this may also slow economic growth if businesses held back because of it. Another option would be to work to drive GDP to grow faster than the national debt. The only problem with this is that there is no way to for sure increase GDP besides through government spending, which would increase the national debt. Finally, we could shift our government spending to areas that create the most jobs such as construction work or education. We will most likely not pay back our debt any time soon because it is almost impossible to be debt free especially with the rate it is increasing. Although the national debt can be a little scary to think about, we luckily are not at a crisis level yet.

Bibliography

Amadeo, Kimberly. “The U.S. Debt and How It Got So Big.” The Balance, www.thebalance.com/the-u-s-debt-and-how-it-got-so-big-3305778.

Amadeo, Kimberly. “Will the U.S. Debt Ever Be Paid Off?” The Balance, www.thebalance.com/will-the-u-s-debt-ever-be-paid-off-3970473.

“Increase in the National Debt.” GVDC, www.gvdc.org/Natl_Debt_Chart.html.

Tepper, Taylor. “5 Things Most People Don't Understand About the National Debt.” Time, Time, time.com/money/4293910/national-debt-investors/.

“United States Gross Federal Debt to GDP  1940-2018 | Data | Chart.” Trading Economics, tradingeconomics.com/united-states/government-debt-to-gdp.

How Much Attention Should the Government Give the National Debt?

How Much Attention Should the Government Give the National Debt?
By: Ian Petoskey


People always want to know where their tax money goes, well roughly 70% of the countries taxes go towards social security(24%), medicare/medicaid(26%), and national defense(16%). Which means the last 30% is budgeted between eleven different categories and one of those categories happens to be interest in national debt. According to Center on Budget and Policy Priorities, the current percent of government spending towards the national debt is 6%. The national debt is around
$20.7 trillion, while our GDP is only $19.8 trillion which means our gross debt to GDP ratio is 104.77%. Since the ratio is so high it’s not good for our national debt to be higher than the current GDP because we owe more than what we are making. Using the “US Debt Clock” we can trace back the GDP and the national debt. After tracing back the national debt never gets any smaller and continues to increase higher year after year. With the national debt going up year after year it seems the government has no interest on fully minimizing our national debt, so why not focus the money on other categories and not worry about our debt until we can pay it back. We could focus on other programs that need improvement more than others.

Since 2007, our nation’s debt consistently increases $1 trillion each year. The government keeps putting money towards our debt even though it’s not going down. “It's unlikely America will ever pay off its debt. It doesn’t need to while creditors remain confident they will be repaid. Most creditors don’t worry until the sovereign debt is more than 77 percent of GDP(Amadeo).” Although our sovereign debt is over 77% doesn’t mean we can’t expand or fix our issues, but it will take time. To think during World War II the debt was $260 million which was 14% more than the GDP but they had expanded in just three years, so the debt today will be canceled out by the future’s economic growth. Since the national debt can’t be paid off in one day, why not put it aside till the government improves other categories until it brings in more tax money for the government to be able to pay off the national debt. To improve other categories, the government could put the money invested in the national debt into other categories such as education, science, and medical research, or even invest more in the social security, medicare, and national defense. Why should we invest in a problem that can’t be fixed in a couple days, when we can expand our nation’s economy by improving the quality of life?


Works Cited
Amadeo, Kimberly. “3 Reasons Why the U.S. Debt Will Never Be Paid Off.” The Balance, www.thebalance.com/will-the-u-s-debt-ever-be-paid-off-3970473.

“National Debt of the United States.” Wikipedia, Wikimedia Foundation, 25 Feb. 2018, en.wikipedia.org/wiki/National_debt_of_the_United_States.

“Policy Basics: Where Do Our Federal Tax Dollars Go?” Center on Budget and Policy Priorities, 10 Oct. 2017, www.cbpp.org/research/federal-budget/policy-basics-where-do-our-federal-tax-dollars-go.

U.S. National Debt Clock : Real Time, www.usdebtclock.org/index.html.

Thursday, February 22, 2018

Are We at Full Employment?

Are We at Full Employment?
Bella Dettlaff

We have reached Full Employment. As of 2018, the United States is arguably close to full employment for all citizens in America. When citizens and economists communicate on full employment, that doesn’t mean that you can cut unemployment to zero and that does not mean that everyone has a job. In that case, if unemployment falls too much then inflation will rise as employers will compete to hire workers and push up wages too fast. In other words, the real definition of full employment is that unemployment has fallen to the absolute lowest possible level that would not cause inflation.

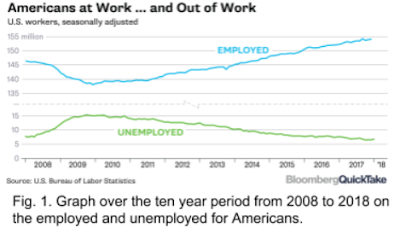
According to the The Bureau of Labor Statistics jobs report, it showed that for nearly about a full year straight, the unemployment rate has remained under 5%. That’s praiseworthy. This is considering the interesting fact that unemployment rate has exceeded 10% during the grand height of the recession. Now, in the recent days, some are saying the constant streak of low unemployment says that the country has reached a big post-recession goal: full employment, which many economists will define as the point where everyone who wants a job has one. This is then essentially, how economists ask whether this is as good as it gets for labor markets. But is America really there yet?

I believe that yes. Yes, the United States is currently at full employment. I believe that they should declare that we are in full employment or that we are at the optimal position. This is because there are economic consequences to calling it too early or too late but I believe that it is the correct time to call it. In theory it would occur when unemployment is as low as it could go. Like stated, the labor market is employing everyone, all citizens who wants to work, but the supply-and-demand dynamics have not yet shifted in a way that causes wages and prices to rise. As teengaers, it’s time to search for that after school, weekend job. This is because employers are willing and wanting to hire all who are willing to work and do their job. Us as teenagers and even citizens older than young adults should be searching for that job as employers will be willing to hire you. So although there has not been a full declaration of the full employment, the United states is there! Teenagers and all who want a job and are willing to work and do what has to be done, should. It’s the time.


Works Cited
Crook, Clive. “Full Employment.” Bloomberg.com, Bloomberg, 10 Apr. 2015, www.bloomberg.com/quicktake/full-employment.

Leubsdorf, Ben. “Economists Think the U.S. Economy Is At or Near Full Employment.” The Wall Street Journal, Dow Jones & Company, 11 Jan. 2018, blogs.wsj.com/economics/2018/01/11/economists-think-the-u-s-economy-is-at-or-near-full-employment/.

White, Gillian B. “Full Employment: Are We There Yet?” The Atlantic, Atlantic Media Company, 27 May 2017, www.theatlantic.com/business/archive/2017/05/full-employment/528339/.

The Macroeconomics of Valentine’s Day

The Macroeconomics of Valentine’s Day
Janie Xue

As with every major holiday, Valentine’s Day is characterized by a boom in consumer spending.  Couples are splurging on fancy dinners, chocolate sets, and flower bouquets; single individuals buy gifts for family, friends, or themselves. Everyone is buying something --  and this dramatic increase in spending results in significant economical impact.

Valentine’s Day spending has been on the rise. The National Retail Federation estimated that Americans were to spend $19.6 billion on Valentine’s Day in 2018, with the average consumer
paying about $145. The increase the spending could be partially attributed to the wealth effect. Price levels of popular Valentine’s Day goods -- candy, flowers, greeting cards -- have remained relatively stable, allowing consumers to have more purchasing power. The increase in purchasing power in turn causes consumers to spend more. Additionally, America has been in the expansion phase of the business cycle, offering more confidence to consumers as a result and encouraging a more expensive night out.

The holiday is a clear contribution to our gross domestic product, which is calculated based on expenditures largely consisting of consumer spending. When consumers are spending more and saving less on Valentine’s Day, our GDP benefits. The effects of the holiday spending are further amplified by our current low interest rates.

The infographic displays consumers’ top spending categories. Even non-celebrants will be participating  For the full chart of consumer spending statistics on Valentine's Day, visit
Forbes.com.


Works Cited
Amadeo, Kimberly. “Shoppers Feeling the Love This Valentine's Day.” The Balance, www.thebalance.com/happy-valentine-s-day-retailers-feeling-the-love-3306043.

FEBRUARY 4, 2016 | FINRA STAFF. “Love, Romance and Dollars: The Economics of Valentines Day.” Love, Romance and Dollars: The Economics of Valentines Day | FINRA.Org, 18 Jan. 2018, www.finra.org/investors/love-romance-and-dollars-economics-valentines-day.

Kurtzleben, Danielle. “CHARTS: The Economics of Valentine's Day.” U.S. News & World Report, U.S. News & World Report, www.usnews.com/news/articles/2013/02/14/charts-the-economics-of-valentines-day.

McCarthy, Niall. “The Key Consumer Spending Trends On Valentine's Day [Infographic].” Forbes, Forbes Magazine, 9 Feb. 2018, www.forbes.com/sites/niallmccarthy/2018/02/09/the-key-consumer-spending-trends-on-valentines-day-infographic/#3d1ccc3f7aa5.


The Rise of the Student Loan Interest Rates

The Rise of the Student Loan Interest Rates
By Kate Majeskie

It is not a secret that secondary education can cost an individual their lifelong savings and more. Most students are dependent on being granted loans to pay for college, even in addition to government financial aid and merit scholarships. In fact, the average American student graduates college with about $25,000 in student loan debt, meaning they will have to pay about $280 each month over a 10-year period (“Budgeting”). Now, what some people might dismiss is the interest rate for student loans repayments. With that same statistic in mind, remember that the student still has to pay back that interest amount as well. According to a financial website called College in Colorado Money 101, student loan interest rates are - on average - 6.8% (“Budgeting”). Paying back an initial loan for college plus that whopping 6.8% interest rate is hefty, which is why it is important to understand the economy at large, as well as the interest rate effect. In addition, knowing how aggregate supply and demand impacts the nation’s purchasing power after college is crucial, simply because the interest rate of the student loan is continuing to rise. This is negativity for individuals that have passion for learning and a personal need to attend a secondary education institute.

As just previously mentioned, we all know that college is insanely expensive and it needs to be paid for somehow. Yes, parents, financial aid, and scholarships help, however, that is not nearly enough help in 2018. As of January 2018, there are “44.2 million Americans with student loan debt” (“A Look”). The numbers are skyrocketing, and the interest rates are following that trend as well. For example, according to an article on TIME Magazine’s website, “The interest rate for undergraduate students is 4.45% for the 2017-18 school year, up from 3.76% for the current year. Graduate students can borrow at a rate of 6%, up from 5.31%. And for graduate students and parents who take out PLUS loans, the interest rate will be 7%, up from 6.31%” (Mulhere). See the image to the for a visual representation of the increasing rates. These numbers are staggering and the interest rate effect states that the borrowing cost is increasing because the price level of the economy is increasing, but students need the loans at that moment to afford their education. There is not waiting or holding back, which can be a difficult situation during a certain point in the nation’s economic state.

According to an article published on CNBC, “Inflation is accelerating and may well push interest rates higher, allowing the fed to move policy rates three times this year, and perhaps even four” (Dickler). While the United States economy is doing better than in previous years, young adults are not looking forward to paying a potential 6.0%+ interest rate after already spending thousands on college alone. However, due to demand for education and the fact that many careers require post secondary education, people consider it a necessity to pay these increasing interest rates even though, according to aggregate demand, their money is not going as far. You see, if the government and banks increase their interest rates on student loans, the aggregate demand curve will actually shift leftwards (see image) simply because the consumer’s money is not going as far. This is called a demand shock. According to an ACDC video specialized in aggregate demand, Mr. Clifford states that when this happens, it is due to inflation, meaning that the price level is increasing and people do not want to spend as much (ACDC). However, students will spend that money because they want to succeed post high school and post college.

Student loans are a hassle, and these increasing 6%+ interest rates do not help these poor college students. There needs to be a sudden change in these rates because as the price level begins to increase more, those interest rates will do the exact same. Borrowing money for college is not the same as borrowing money for a material good; it is a necessity for some and the interest rate effect is not helping for the overall aggregate demand of the nation’s individuals seeking further education.


Works Cited 
ACDC Leadership. “Macro 3.1 - Aggregate Demand Practice.” YouTube, 2 May 2014, https:// www.youtube.com/watch?v=l6Udc6uDX8o.

“A Look at the Shocking Student Loan Debt Statistic for 2018.” Student Loan Hero, 24 Jan. 2018, https://studentloanhero.com/student-loan-debt-statistics/.

“Budgeting for Student Loan Repayment.” CollegeInvest, 2012, http://www.cicmoney101.org/ Articles/Budgeting-for-Student-Loan-Repayment.aspx.

Dickler, Jessica. “What You Need to Know About Rising Interest Rates.” CNBC, LLC., 17 Feb. 2018, https://www.cnbc.com/2018/02/16/what-you-need-to-know-about-rising-interest- rates.html.

Mulhere, Kaitlin.  “The Rate for Undergraduate Student Loans Is About to Climb to 4.45%.” TIME Inc., 11 May 2017, http://time.com/money/4774325/student-loan-interest-rate -increase-2017/.

Economics of the Shamrock Shake

Economics of the Shamrock Shake
Hailey Johnson

As winter begins to fade, there is an indisputable excitement that clearly indicates Spring is approaching: the release of the McDonald's Shamrock shake. This famous minty-flavored drink has been an popular item on the seasonal menu, reappearing in the market every late February to celebrate St. Patrick’s Day. The shake first appeared in the 1970’s being called the St. Patrick’s Day Shake. However, as the name was not catchy enough, Mcdonald’s took an alternative approach and renamed the drink the Shamrock Shake. And, due to high marketing and advertising, using sayings like “back for a limited time”, a variety of people began noticing this seasonal treat. Since more than 33 million Irish-American people in the United states celebrate St. Patrick’s Day, according to a senior writer, John Kiernan, there will be more of an incentive for them to buy the green drink as it corresponds with the very festive holiday. Therefore, as the Shamrock Shake sporadically makes its way back into the Mcdonald’s menu, people will fall into temptation and buy as many Shamrock Shakes as they can before they are gone until 2019.

As the popularity of the shake increases, the consumer spending brings us into the economics. Since the most important factor of consumer spending is made up of a person’s disposable income, this gives people the opportunity to make choices on what they spend their money on. Specifically, since the popular shake is a highly-anticipated item - being in demand for months before the release of the shake - people are willing to spend their current disposable income on this product. While the shake is only at a low price of $2, its seasonal aspect only gives consumers so much time before it disappears from the Mcdonald’s menu once again. Since the item is so scarce and supply is low, the demand of the product is extremely high. Even if aspects change of a person’s income, causing their disposable income to either increase or decrease, the scarcity of the shake may still be enough for consumer to spend their money on the delicious minty treat.

People all over the nation are anxiously waiting for the Shamrock Shake to arrive at their local Mcdonald’s. Due to the popularity around the item, people would be willing to spend their disposable income on the product, ultimately increasing the country’s GDP for a short amount of time whether they know it or not.


Works Cited
Harvey, Olivia. “When is the Shamrock Shake Coming Back?” Hello Giggles, 15 Feb. 2018. https://hellogiggles.com/news/when-is-the-shamrock-shake-coming-back-mcdonalds/

Kirnan, John. “St. Patrick’s Day Facts.” Wallet Hub, 9 Mar. 2017. https://wallethub.com/blog/st-patricks-day-facts/10960/

Mcdonald, Andy. “Here’s Everything you Want to Know About the Shamrock Shake.” Huffpost, 6 Dec. 2017. https://www.huffingtonpost.com/2014/03/14/shamrock-shake-information_n_4916266.html

Wednesday, February 21, 2018

Super Prices

Super Prices
Jack Doubek

As the end of the professional football season draws to an end, the USA receives one of the largest spending days of the year, the Super Bowl. An event this large is no joke and plays a major role on the country’s GDP for the entire year. Not only is there an enormous amount of hype leading up to the big game, but football fans across the country stock up on millions of chicken wings, beverages, and lots of other necessities to throw a good Super Bowl party. Even if they aren’t watching the game at a party, restaurants are packed with fans. The average Super Bowl related consumer spending has almost doubled from 8.71 billion dollars in 2007 to 15.3 billion in 2018. 


Not only do stores and restaurants make an huge profit on Super Bowl Sunday, it one of the biggest days for TV advertisements. With an estimated over 100 millions viewers of the game, it is the best chance for companies to get their word out and attract new or returning customers for their products. But getting all these viewers for an advertisement doesn’t come without a super price. Since Super Bowl XXXVI in 2002, advertisement prices have more than doubled for a 30 second commercial from 2.3 million dollars to a whopping 5 million in 2018.

With all of the prices from food to advertisements to tickets rising dramatically over the past few years, what is the cause? Besides the high demand and low amount of tickets creating scarcity among fans, some say that it is due to our economy. According to NBC News, the high costs for Super Bowl tickets is caused by the “low unemployment and a booming economy…”, creating more “Americans willing to splurge…” (Spector). Due to the growing GDP of America, people are making more money and more willing to spend on Super Bowl Sunday. Not only are people able to pay for higher for tickets and buy more food, but businesses are able to pay more for an advertisement on the one day a year where some people admit that they watch television for the commercials. So while we wait for the Green Bay Packers to get their act together and get to the Super Bowl again so us Wisconsinites can actually care about the game, the numbers will continue to rise as long as America’s economy continues to grow and we care about the real kind of football.


Works Cited

All products require an annual contract.    Prices do not include sales tax    (New York residents only). “Super Bowl 30-Second Ad Costs 2002-2018 | Statistic.” Statista, www.statista.com/statistics/217134/total-advertisement-revenue-of-super-bowls/.

Gordon, John Steele. “The Super Bowl and the GDP .” Commentary Magazine, 30 June 2015, www.commentarymagazine.com/culture-civilization/popular-culture/super-bowl-gdp-madonna%E3%80%80/

Spector, Nicole. “Has the Booming Economy Led to Pricier Super Bowl Tickets This Year?”NBCNews.com, NBCUniversal News Group, 4 Feb. 2018, www.nbcnews.com/business/consumer/has-booming-economy-led-pricier-super-bowl-tickets-year-n844281.

“Super Bowl Consumer Spending 2007-2017 | Statistic.” Statista, www.statista.com/statistics/217141/super-bowl-weekend-related-consumer-spending-in-the-us/.

Staff, Marketplace. “5 Things You Need to Know about the Super Bowl Economy.”Marketplace, Marketplace, www.marketplace.org/2018/01/26/business/5-things-you-need-know-about-super-bowl-economy.

The Power of Social Media

The Power of Social Media
Calista Bulacan

Snapchat, Instagram, Twitter and Facebook are all phone applications that are the social media powerhouses in the United States. With almost 81% of the nation having at least one form of social media and 98% being connected to wifi, these applications are more accessible than ever. What started as a way to connect people, now has transitioned into an aggravating game for users between social media platforms and advertisers. Recently, ads have started to take on a greater role in all of the big name apps. There are now advertisements between stories on snapchat, advertisements that are disguised as posts on instagram and paid marketing on Youtube and Twitter. The advertisements are a smart way to make money for companies, but can become a hindrance on the enjoyment of these platforms by the general public.

When scrolling through Snapchat stories, the user generally is not looking for anything other than becoming informed on what friends are up to. However, when a movie advertisement pops up, it can form one of two reactions. Either the user will become interested in the said advertisement and then in return, the movie will receive a larger profit when it is released or the user will simply click past and forget it ever even was on the screen. Ignoring the latter of the two reactions, advertising on social media platforms is actually a smart move. With over 600 million Instagram users, billions of Youtubers and 300 million Snapchat users, the companies can reach a good population of people. Even if only a small percentage of users actually become interested in the advertised product, that still is a profit they otherwise would not of been able to earn.

From 2014 to 2017, it is estimated that the advertising revenue on social media platforms has increased by 23.1 billion dollars. This positive relationship between the apps and the advertisers may actually keep some apps able to continue to cater to their many users. The more users that start using an app, the higher the demand is for applications to continue updating and improving. The advertisers must pay to have their products featured on the application which can help fund the cost of keeping the company from sinking as well as help make an overall profit. This advertising then will bring the possibility of new consumers and, in turn, help make the business make a profit as well. This is a mutually beneficial relationship, that really only can be a negative for the consumers themselves as a third party.

This benefit, though, prompts companies to make internet even more accessible around the world. Facebook’s CEO, Mark Zuckerberg, is trying to make internet more accessible in parts of the world where internet connectivity rates are relatively low. In fact, only about 2.8 billion people out of 7.2 billion people in the world have internet access. He plans to implement balloons and drones that will bring free or extremely cheap wifi to the less technically advanced countries. This would help people who never had the option to be online and also encourage technological innovation. On top of this, however, advertisements would be able to become even more widespread than they currently are.

I agree that advertisements are annoying when I am just trying to catch up on what my friends are doing. Yet, those couple seconds of my time used to watch that ad are indirectly helping people around the world gain internet access and have a better quality of life.

Works Cited
Evans, Chris. “98 Percent of Americans Are Connected to High-Speed Wireless Internet.” National Archives and Records Administration, National Archives and Records Administration, 25 Mar. 2015, obamawhitehouse.archives.gov/blog/2015/03/23/98-americans-are-connected-high-speed-wireless-internet.

Silva, Joao Fernandes. “The Economics of Social Media.” The Market Mogul, 23 Apr. 2017, themarketmogul.com/social-media-economics/.

“U.S. Population with a Social Media Profile 2017.” Statista, 2018, www.statista.com/statistics/273476/percentage-of-us-population-with-a-social-network-profile/.


Video link to “Social Media Advertising” on Youtube: https://www.youtube.com/watch?v=HC-tgFdIcB0

Trump's Major Impacts

Trump’s Major Impacts
Alex Kraussel

After winning the election in 2016, Donald Trump looked to “Make America Great Again”. But what has he really done? When looking at the statistics, he has had a yuuuuuge impact on the stock market. The S&P 500 was at a decrease right before Trump was elected, but after, it was at a major increase. It had increased around 550 points. Not only has the S&P 500 risen, but the whole stock market in general. The market has hit record highs ever since Trump was elected. Last month in January, the market had been thriving. Although, it has hit a bit of a wall. High interest rates and inflation are to blame. This has been a problem on notice for a little while now. But it is finally being realized that this problem is real and happening.

Not only did Trump help the stock market, but he has brought unemployment down to a record low too. It is current
ly at 4.1%. This is the lowest in recorded U.S. history. This is also a huge deal because this was one of the topics Trump had promised during his campaign. This has also lead to a tax break, saving many less wealthy families extra money that they can utilize for basic needs.


To close, I believe that people should put their grievances against trump aside and give him a chance. He may not be the best person personality wise (based on opinion), but he sure has done a lot for our economy and market. Personally, I believe that he has had more benefits on our country than drawbacks. I also think that he is a great leader for us. He is one of the first presidents who tells it how it is, and I really admire that about him.


Works Cited

 Chu Economics Editor, Ben. “What Has Donald Trump Achieved for the US Economy 12 Months after Winning the Presidency?” The Independent, Independent Digital News and Media, 8 Nov. 2017,

Shen, Lucinda. “Trump Loves Taking Credit for Stock Market. Other Presidents Did Better.”Fortune, 8 Nov. 2017, fortune.com/2017/11/08/donald-trump-record-stock-market-election/.

Friday, February 16, 2018

How Much We Spend For Love

 How Much We Spend For Love
Written by: Brooke Jende

February 14th is either an excitedly anticipated holiday or a highly dreaded one. Many couples and loved ones enjoy Valentines day and see it as a chance to celebrate love. On the other hand, many see it as a corporate ploy to get people to spend money on romantic gift items that they do not need. While I believe that the idea of Valentine's Day is sweet and romantic, the reality is that Valentine's Day has simply become a way for businesses and companies to get people to spend their money on overpriced goods. 

Just like for Birthdays and Christmas, Valentine's day revolves around gift giving. The significant difference when it comes to Valentines gifts are that they typically fall into the realm of chocolates, flowers, and other love related items. Because these are common valentines goods, stores take advantage of the holiday and the aggregate price level of Valentines goods are increased during this time. While we economists would typically see an increase in price level result in a decrease in amount demanded, the increased holiday demand for these products is what allows companies and businesses to rack up their prices and yet still get consumers to purchase the products. This year in particular, According to the National Retail Federations latest statistics, “Consumers will spend a near-record $19.6 billion on Valentine's Day.” The large profits and high prices both confirm my belief that Valentine’s day is becoming a holiday that's all about making more money. 

While I believe Valentine’s Day has become a commercialized way get people's money, there is a positive effect on the economy as a result of this holiday and it can be related to the multiplier effect. The multiplier effect states that given change in a particular input, such as Valentines Day goods, a larger change in an output will occur. In the case of Valentines Day, people are spending more of their money on Valentines items. Because of this the money they spend will directly benefit the companies, business selling the items and will then use that money and create a strong multiplier effect, which will in the end increase the Gross Domestic Product. 


Works Cited

“Explaining the Multiplier Effect | tutor2u Economics.” tutor2u, www.tutor2u.net/economics/reference/multiplier-effect.

Ngabirano, Anne-Marcelle. “On Valentines Day, heres how much were willing to spend for love.” USA Today, Gannett Satellite Information Network, 14 Feb. 2017, www.usatoday.com/story/money/2017/02/13/more-expensive-year-show-your-love/97766678/.

“Valentine's Day.” National Retail Federation, 13 Dec. 2016, nrf.com/resources/consumer-research-and-data/holiday-spending/valentines-day.

Thursday, February 15, 2018

Why Would you Host the Olympics?

Why Would You Host The Olympics?
Josh Geisel

The Olympic games are hosted every other year by the country who is willing to spend the most money on the games, this money is often seen as an investment and a small cost compared to the potential profit for the country. Usually, the budget of the games is well below the amount of money a country can afford and the predicted profit makes the games seem like a no-brainer when it comes to investments. With the games, comes a massive expectation to out-do the last host of the Olympics which in turn means more money needs to be spent. The budget can be quickly diminished before the games even start as the countries don’t take into account setbacks and problems while creating the games.


Almost every Games for the last few decades have gone over budget at least a little bit. In 2014, Sochi held the Olympic games and the final cost was 289% of their budget and 51 billion dollars. To put the 51 billion dollars in perspective, The Dallas Cowboys stadium is regarded as one of the best stadiums in the United States and that stadium costed 1.3 Billion dollars to build, which is only a tiny fraction of how much money was spent in Sochi. Although the budget of the Olympics includes: building infrastructure, travel costs, payroll of employees, and other expenses. This is still a lot of money and is more than any other by almost 10 billion dollars.

Isn’t the money spent on the Olympics only an investment for the huge profits that will come in the end? The profits, in the end, are anything but guaranteed. Over the years there have been many games that came out ahead such as The Vancouver Winter Olympics which raked in almost 2 billion dollars for the country and The Beijing Olympics which earned about a billion dollars. But these countries are outliers compared to other Olympics such as the Sydney Olympics which lost over 2 billion dollars and even the Athens Olympics which lost a whopping 14.5 billion dollars in their investments.

Why would a country host an Olympic Games if it is such a bad investment? The Olympic Games is unlike any other world event. 3.6 billion people are expected to watch the 2018 Olympics this year which is nearly half of the world’s population. The Host country is definitely put on the world’s stage during the weeks of the Olympics which can make or break how other people feel about the country for years to come. A good Olympics will boost tourism for years to come and in turn increase economic growth. But a bad showing of the Olympics can ruin the future of the country in terms of tourism, which is why countries are willing to spend so much money for the Olympics and lose money. The money lost in the Olympics can and will be made up in the end if the country spends the money to make the Olympics great which is why the investment in the Olympics isn’t as bad as it seems.
Works Cited

“Cost of the Olympic Games.” Wikipedia, Wikimedia Foundation, 11 Feb. 2018, en.wikipedia.org/wiki/Cost_of_the_Olympic_Games.

Goldblatt, David. “Cost of Hosting the Olympics: How It Got So Expensive.” Time, Time, 26 July 2016, time.com/4421865/olympics-cost-history/.

McCarthy, Niall. “The Massive Cost Of Hosting The Olympic Games [Infographic].”Forbes, Forbes Magazine, 4 Aug. 2016, www.forbes.com/sites/niallmccarthy/2016/08/04/the-massive-cost-of-hosting-the-olympic-games-infographic/#6b2b6f772e38.

Chinese Imports and Exports Set to Surge Forward

Chinese Imports and Exports Set to Surge Forward
By Christa Buth
As of right now, a large majority of any American’s belongings were made in China, this is because of the large capacity of exports China has, and it is only getting greater. As Mr. Reuter said in class, ”I will give $20 to anyone wearing only clothes produced in the U.S.”. China and other countries exports support a great deal of America’s products. Thus with China’s exports rising, Americans can expect quite a few more products with the infamous “Made in China” sticker.
As of January 2018, China reported a 36.9% rise in imports and an 11.1% rise in exports. Because China’s trade surplus for the month amounted to a whopping $20.34 billion, it beat expectations set by a poll produced by Reuters (a business and financial news source). To be exact the data exceeded the polls expectations by 27.1% gap in imports and a 1.5% gap in exports. Now festivals, such as the Long Lunar New Year, may alter trade data for the month. This is due to increased spending for the holiday festivities and buying gifts that may be shipped from outside countries. But thus far there has been healthy domestic trade in 2018. 
As a change from past years (see graphs) data collected for the month of December 2017 indicated imports had risen 4.5% from where they were a year ago. Most of China’s imports are raw materials from Central America and Africa. China’s commodity consumption has fueled a world-wide boom in mining and agriculture. Specifically coal imports reached their highest rates since January 2014, according to Reuters records. This is most likely caused by colder weather hitting China and raising the public need for coal. It is natural for economies to fluctuate through time and as of right now the numbers are showing an upward trend. This meaning that China will be taking in more materials from other countries. Data currently shows exports have decreased a little, but with the upward trend set in January it is optimistic to say the trend will continue to rise. Data collected from December of 2017 shows that exports had risen 10.9% from where they were in December 2016, a great feat. With a larger global need for China’s exports, this boosts need for laborers and bringing the unemployment rate further down. With more citizens employed there are more active consumers, therefore boosting China’s economy.
In total January alone produces a trade surplus of $20.34 billion dollars while polls produced by Reuters predicted a 54.1% trade surplus. 


As of right now, China is the world’s second largest economy and grew by 6.9% last year. This beat strong predictions made for strong global and domestic demand. According to Tan Huileng for CNBC, ”a favorable external environment will continue to support China's exports in 2018. However, domestic demand may face challenges if there is a "a more pronounced-than-expected impact of the planned financial tightening and slower real estate activity,". If all goes well, China is looking towards a prosperous future. 


Graphs
https://tradingeconomics.com/china/exports
https://tradingeconomics.com/china/imports

Sources
https://www.cnbc.com/2018/02/07/china-reports-january-exports-imports-trade-data.html
https://www.thebalance.com/china-economy-facts-effect-on-us-economy-3306345


Classics are back in Style

Classics are back in style
Shannon Huren

If I were to tell you that in 2018 one the most popular and profitable brands out right now would be Champion would you believe me?  Well Hanesbrands saw sales climb 2 percent in the third quarter ended Sept. 30, to $1.80 billion, returning to organic sales growth, for the first time in eight quarters. The rise was driven primarily by double-digit international segment growth. On the international front, net sales increased 16 percent and operating profit increased 25 percent for the International segment in the third quarter. Results were mainly driven by the high demand of Champion and brand growth in Europe and Asia (http://us.fashionnetwork.com).
Hanesbrands Inc. Stock


 Champion apparel was everywhere in the 90’s and was a very popular in sportswear. Champion produced uniforms for all the NBA teams during the 1990s, and some NFL teams during the 1980s and 1990s. It has also produced sportswear for many major colleges.Champion was also the kit manufacturer of the Olympic basketball team also known as the “Dream Team”  that competed at the 1992 Summer Olympics.  Even at the time when there was only a fraction of the number of clothing brands that there are now, there weren't many labels that had Champion's insane demographic reach. It was the uniform for jocks and preps, but also for skaters and hip-hop heads. Champion was all over the hardcore punk scene, but it was just as popular among jam band fans.

Then the hype died down drastically Champion went from being one of the hottest brands out to being a Walmart brand. During the early 2000’s to just recently Champion was known to most as an afterthought. A brand that was really only bought in stores like Walmart or Target something cheap and lacking in quality.  Champion was and still is being sold in Walmart or Target however, the newer Champion gear is completely separated from the Walmart lines.

One key element in the brand's comeback has been Champion’s way of capturing the eyes of the quote on quote “Hypebeasts” as well as the causal shopper. Champion has done that with a barrage of headline-grabbing  collections with a broad range of collaborators, from Supreme to Vetements even brands like A Bathing Ape,and Wood Wood. These major collabs not only kept Champion's name in everyone's mouth, but also highlighted the brand's versatility. 

Nowadays Champion is at the forefront of 90’s nostalgia within fashion.  In a quote from Manny Martinez (Champion’s global brand ambassador) he said, “I think we're in a golden hour. The brand doesn't actually need collabs right now. Not that we don't appreciate them, but now is when the brand can live on its own. When you see Kylie Jenner wearing the brand on her own, it's not because it's a collab. You see people wearing it because it's Champion. That's the beauty of it."

Champion is a brand that’s seen it’s fair share of highs and lows over the years. However, it’s hard to understate the phenomenal comeback of this brand. There comeback is something that brands looking to resurrect or emerge in the fashion scene need to look and model their approach after Champion. Don’t be surprised if you see Champion continue to succeed and prosper in the fashion industry.

https://www.youtube.com/watch?v=Gth1y6yuNLg
Watch the video :)
“THE BIGGEST UPCOMING HYPE BRAND! HOW CHAMPION IS GETTING HYPE!”

Works Cited
Jennifer,Braun. “Hanesbrands Revenue Hits $1.8bn, Global Champion Sales up 16%.” FashionNetwork.com, 1 Nov. 2017, us.fashionnetwork.com/news/Hanesbrands-revenue-hits-1-8bn-global-Champion-sales-up-16-,886698.html#.WoOW4oPwbZ6.
Raymer, Miles. “How Champion Became One of the Coolest Brands Around-Again.” Esquire, Esquire, 9 Oct. 2017, www.esquire.com/style/mens-fashion/news/a54070/champion-sweats-comeback/.

Tuesday, February 13, 2018

Spain’s Surprising Growth

Spain’s Surprising Growth

Written by: Payton Wolf

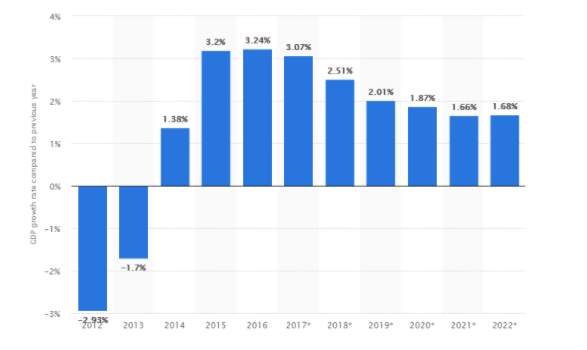
Spain was one of the countries that was most affected by the eurozone crisis, which brought it's economy to the brink of collapse. Unemployment rose as industrustries could not pay minimum wage for its employees during the recession. However, over the last couple of years, Spain has managed to increase its GDP and recover from this disaster. In 2014, it's economy grew 0.6% and 0.6% in the second and third quarters of the fiscal year, respectively. Why that may not seem like a large growth, in reality, this is an increase of several million dollars in some cases. Spain was able to recover because it focused on increasing the amount of goods it exported.

Exports are one of the factors that contributes to a country's Gross Domestic Product, along with consumer spending, investment spending, and government spending. Exports improve the GDP because Spain produces new goods within the borders of the country. The goods that are produced 2014 contributed in the economic growth recorded during that year. If the goods had been produced in a different country, for example France, they would not have been included in Spain’s GDP, so they focused on loyal, sometimes family run businesses to produce within the country. Specifically, Spain focused it's manufacturing efforts in pharmaceuticals, automobiles, capital goods, and more. These industustries are centered around exporting their goods to other countries, increasing Spain’s total GDP.

Producing exported goods within the country also increased the employment rate, and the number of people in the workforce. During a recession, it is common for people to give up looking for a job because there are simply no jobs out there. At this point, these disgruntled people are no longer considered unemployed, nor are they a part of the workforce. However, using local businesses and industries allows more local citizens to find jobs, increasing the employment rate. Increasing the amount of exports in a country is a very effective way to not only increase the GDP of a country, but also increase the amount of citizens who have jobs and are able to provide for their family. Spain is likely going to continue growing economically due to this decision, possibly surpassing other large European nations.


Works Cited
“Economic Forecast for Spain.” European Commission - European Commission, 7 Feb. 2018, ec.europa.eu/info/business-economy-euro/economic-performance-and-forecasts/economic-performance-country/spain/economic-forecast-spain_en.

Monaghan, Angela. “Spain's Economic Recovery Gathers Momentum.” The Guardian, Guardian News and Media, 30 Oct. 2014, www.theguardian.com/world/2014/oct/30/spain-economic-recovery-growth-quarter.

China’s Outrageous Economic Growth

China’s Outrageous Economic Growth

By Morgan Impola

China has been a long time player in the world economy, but China itself has been stagnant in its’ economy for hundreds of years, often failing to compete with global powers like the British, French, Russian, and Japanese Empires, which often abused the region to exploit resources or to exert domination of China. But over the past 60 years, The “People’s Republic” has grown to one of the largest powers in the world, dominating industries that factor into production whilst also having a bounty of natural resources to boot. This lucky combination of resources, labor, and domestic industry have allow China’s GDP to grow at insane rates, topping at 6.9% during the last quarter of 2017, in comparison, the GDP growth of the United States was around 4%.

With the increase of GDP growth means that the overall GDP will continue to grow if they expand their domestic production, leading to and increase in consumer spending, which further cycles into the Nominal GDP of China each year it continues to grow.

One of the less-known factors of China and their insane GDP growth is the fact that with overall GDP growth ties in GDP per capita: Many Chinese citizens are moving toward the middle class. The shift from rural farming, to urban development not only advances the society as whole, but also provides a bountiful land of opportunity for many newly endowed urban dwellers. This focus on urban development has created many issues socially. First and foremost is the issue of peasants who have been farming for a large chunk of their lives suddenly being thrusted into a society that revolves around skills that consider technical prowess- something that rice farming does not require in any manner. There also is the issue of housing, most of China’s coastal cities are larger than some countries, and this isn’t even considering if the inhabitants have proper housing; Take the city of Hong Kong for example. Hong Kong is a former protectorate the British Empire and is an economic gem for China, but regarding housing, many city dwellers are relegated to up 40 square feet apartments for multiple people! (To put this into perspective, an entire apartment could be the size of a king-sized bed for three people). This type of housing predicament seems odd considering Hong Kong is also home to some of the most luxurious and exclusive housing in the world.

While the economic gains of China are pretty significant, with the insa every nne GDP growth rate, there are a significant amount of underlying issues that are often hidden from the public eyes, mainly the plight of the lower classes. But what can be said is that China is no longer the laughingstock of the Orient, rather they are carving their own path in every nook and cranny across the world, even if you don’t know it yet.


Works Cited
Bradsher, Keith. “China's Economic Growth Looks Strong. Maybe Too Strong.” The New York Times, The New York Times, 18 Jan. 2018, www.nytimes.com/2018/01/18/business/china-gdp-economy-growth.html.

“Hong Kong's Shocking 40-Square-Foot Apartments Photographed by Chinese Human Rights Group.” Inhabitat Green Design Innovation Architecture Green Building, inhabitat.com/chinese-human-rights-group-releases-shocking-aerial-photos-of-hong-kongs-locker-sized-apartments/.

Are We at Full Employment?

Are We at Full Employment?
Bella Dettlaff

We have reached Full Employment. As of 2018, the United States is arguably close to full employment for all citizens in America. When citizens and economists communicate on full employment, that doesn’t mean that you can cut unemployment to zero and that does not mean that everyone has a job. In that case, if unemployment falls too much then inflation will rise as employers will compete to hire workers and push up wages too fast. In other words, the real definition of full employment is that unemployment has fallen to the absolute lowest possible level that would not cause inflation. 

According to the The Bureau of Labor Statistics jobs report, it showed that for nearly about a full year straight, the unemployment rate has remained under 5%. That’s praiseworthy. This is considering the interesting fact that unemployment rate has exceeded 10% during the grand height of the recession. Now, in the recent days, some are saying the constant streak of low unemployment says that the country has reached a big post-recession goal: full employment, which many economists will define as the point where everyone who wants a job has one. This is then essentially, how economists ask whether this is as good as it gets for labor markets. But is America really there yet? 

I believe that yes. Yes, the United States is currently at full employment. I believe that they should declare that we are in full employment or that we are at the optimal position. This is because there are economic consequences to calling it too early or too late but I believe that it is the correct time to call it. In theory it would occur when unemployment is as low as it could go. Like stated, the labor market is employing everyone, all citizens who wants to work, but the supply-and-demand dynamics have not yet shifted in a way that causes wages and prices to rise. As teengaers, it’s time to search for that after school, weekend job. This is because employers are willing and wanting to hire all who are willing to work and do their job. Us as teenagers and even citizens older than young adults should be searching for that job as employers will be willing to hire you. So although there has not been a full declaration of the full employment, the United states is there! Teenagers and all who want a job and are willing to work and do what has to be done, should. It’s the time. 


Works Cited
Crook, Clive. “Full Employment.” Bloomberg.com, Bloomberg, 10 Apr. 2015, www.bloomberg.com/quicktake/full-employment.

Leubsdorf, Ben. “Economists Think the U.S. Economy Is At or Near Full Employment.” The Wall Street Journal, Dow Jones & Company, 11 Jan. 2018, blogs.wsj.com/economics/2018/01/11/economists-think-the-u-s-economy-is-at-or-near-full-employment/.

White, Gillian B. “Full Employment: Are We There Yet?” The Atlantic, Atlantic Media Company, 27 May 2017, www.theatlantic.com/business/archive/2017/05/full-employment/528339/.

Thursday, February 8, 2018

An Olympic Expense

An Olympic Expense
Written by: Jaden D.


The world’s largest sporting event, the Olympics, boast millions of attendants and thousands of athletes every year.  With an event this large, there are fantastic opportunities for tourism, which provides a great incentive for countries to try and host the Olympics.  However, despite the glamour, hosting the Olympics is a financially monumental task and raises the question: is hosting the Olympics worth it?

 The 2016 summer games in Rio de Janeiro exemplified the downsides to hosting the Olympics.  With the games over, Rio struggles with huge debt associated with the initial cost of building Olympic facilities, and the additional cost of maintaining these facilities, even though they are no longer used.  On top of that, countries need to make sure that other public goods, such as transportation, are in prime condition to accommodate all the tourists and athletes.  The 2018 Olympics are likely to cost Korea roughly $12.9 billion, which is over double what South Korea expected to pay in 2011 when they agreed to host.  12.9 billion dollars isn’t even extraordinarily high: the Sochi Olympics costed an estimated $50 billion in infrastructure.

From a macroeconomic point of view, there are definitely benefits to hosting the Olympics.  Creating all of the infrastructure, stadiums, and public goods greatly increases the country’s GDP, which some may interpret as a sign of economic growth.  However, from a microeconomic point of view we can realize what’s really going on.  The government is being forced to shell out billions of dollars on public goods that will only see value for the short window that the country is hosting the Olympics.  When the government makes such a large spending decision, or in the case of Korea, ends up paying double the price they expected, it’s not just the government that is forced to shoulder the expenses, but the people.  Taxes will rise to pay off these huge bills, and in 1976 Montreal Olympics, taxpayers were left with 1.5 billion to shoulder over 3 decades. 

Korea has recognized these expenses, and they’re taking steps to avoid falling into the same pitfalls as countries before.  Instead of letting their Olympic stadiums gather dust after the 2018 Olympics, Korea will reservice these facilities as museums to the games.  However, it’s unlikely that this museum will draw in enough tourists to cover all the costs of hosting the Olympics, and the question still remains.  Is hosting the Olympics really worth it?


Works Cited
Elkins, Kathleen. “80% of Americans own an unbelievably small portion of the countrys wealth.” Business Insider, Business Insider, 15 June 2015, www.businessinsider.com/inequality-in-the-us-is-much-more-extreme-than-you-think-2015-6.
“The Economics of Hosting the Olympic Games.” Council on Foreign Relations, Council on Foreign Relations, www.cfr.org/backgrounder/economics-hosting-olympic-games.

Harley Davidson to Shut Down Kansas City Plant

Harley Davidson to Shut Down Kansas City Plant
Written by: Colin M.

While most other industries recovered from the last recession, the motorcycle industry is still in hard times. Motorcycle sales plummeted in 2008 and have continued to decrease ever since. Companies have released new models and new technology in an attempted to gain consumers, however, all have proved unsuccessful. This problem proved unsuccessful for all companies including the industries top manufacturer, Harley Davidson. According to MSN, “Harley made $8.3 million in the fourth quarter of 2017, compared with $47.18 million in the fourth quarter of 2016”(Shilling). With most of their consumers being the baby boomers, they are no longer able to ride as they get older. The hit that Harley is taking may be too big to come back from.

This years fourth quarter profits down over 80% compared to last years fourth quarter profits, and their sales have been steadily declining for years. Retail motorcycle sales for Harley-Davidson internationally, and in the U.S. fell by an average of over 6% in 2017 compared to 2016. Some of the information behind the hit in sales is linked with the lack of safety. With younger generations having safety concerns and the baby boomers, who are a large demographic of their consumers, are getting older. Overall this is leading to a large decrease in demand for Harley’s products.

Due to the struggle in the last few years, Harley-Davidson has made the decision to shut down their third largest United States facility. The Kansas City plant is to be closed in 2019, losing almost 15% of their employees. The workload the plant previously held will be transferred to their plant in York, PA. While this may seem like a big blow to the company, if they are able to keep production up by increasing efficiency, it should help increase revenue.

Additionally at their plant in York, is where their electric motorcycle will be produced starting 2019. The electric motorcycle is also part of their plan to acquire new riders and consumers. Since electric motorcycles don’t have a transmission, the rider doesn’t have to learn how to shift gears. Production of the electric motorcycle also internally benefits the company, as it will bring in 450 new jobs. Harley-Davidson is doing everything they can to keep relevant and succeed, only time will tell if it pays off.


Works Cited
An electric motorcycle. “An Electric Harley-Davidson Is Coming in 2019.” CNNMoney, Cable News
Network, 30 Jan. 2018,
money.cnn.com/2018/01/30/technology/harley-davidson-electric-motorcycle/index.html.

Shilling, Erik. “Harley-Davidson Is Sad And Getting Sadder.” Harley-Davidson Is Sad And Getting
Sadder, 31 Jan. 2018,
www.msn.com/en-us/autos/motorcycles/harley-davidson-is-sad-and-getting-sadder/ar-BBIu0


Related Posts Plugin for WordPress, Blogger...