Thursday, September 25, 2014

“Economics of Ramen”

Morgan Aschenbrenner
Economics B3
Sharon Straub
9/23/2014

“Economics of Ramen”

As the top percentage of the people who are taking this economics class and are about to read this blog are seniors, we have all been college bombarded and focused. We are being told to begin saving as we will soon be entering the real world where we will have to, if we haven’t already been, providing for ourselves and ensuring that we can feed our own hungry mouths. One of the most important staples that feeds the demand of the average college student would be the famous ramen noodle originally brought over from China to Japan to eventually the American people. This instant food is incredibly cheap and has different flavor packets to satisfy the preferences of any individual. Though they seem fantastical and easily could become breakfast, lunch, and dinner to save money, is their lack of nutrition and effects on your body really worth the cheap economic cost?
The average ramen noodle package takes about four minutes to make taking away little time from one’s day to perform other tasks such as working, doing homework, or hanging out with friends. The opportunity cost of ramen noodles is very low making its demand to the busy stressed college student rise. In addition the cost of the instant noodles is averaging from $0.25 to $0.45 a package. Theoretically letting a poor college student spend a dollar a day to ensure their bare minimum nutrition is met.  
Below is a chart depicting the percentage of how often people on average consume ramen


However, relying on ramen isn’t exactly the best idea far as nutrition goes. Ramen is very high in salt and other things in high quantities which aren’t exactly helping you in any form. A study published in the Journal of Nutrition found that ramen noodles could actually be leading to shorter lives. Along with other forms of instant noodles it is actually increasing a person’s risk for cardiometabolic syndrome. In addition most instant noodles are packaged in Styrofoam which contains BPA which is a hormone disruptor, and it also contains MSG on top of being high in saturated fat. In fact a viral video was made of what happens when one’s body tries to digest the noodles which showed the stomach working over time.
As we are about to enter a new world of responsibilities as young adults, we need to start making our own life decisions that will follow us for the rest of our lives, especially including our own health and nutrition. So before we automatically decide to save money and think thriftily by buying cheap foods like ramen to ensure our survival, we need to be thinking about the negative externalities that is causes to our health. Just because our savings may have increased by a small marginal benefit, is it really worth it?  

Johnson, Carolyn. "The global power of instant noodles ." The Boston Globe . N.p., n.d. Web. 21 Sept. 2014. <http://www.bostonglobe.com/ideas/2013/09/08/the-global-power-instant-noodles/slwhJDp9yoE6M5C1uokrlJ/story.html>.

Brickman, Sophie. "The History of Ramen Noodles." The New Yorker. N.p., n.d. Web. 21 Sept. 2014. <http://www.newyorker.com/culture/culture-desk/the-history-of-the-ramen-noodle>.

Y-N, Ken. "The impending instant ramen sticker shock ." What Japan Thinks . N.p., n.d. Web. 21 Sept. 2014. <http://whatjapanthinks.com/2007/11/05/the-impending-instant-ramen-sticker-shock-part-1-of-2/>.
Greenfield, Beth. "Why Ramen Noodles Could Cut Your Life Short ." Yahoo Health . N.p., n.d. Web. 21 Sept. 2014. <https://www.yahoo.com/health/why-ramen-noodles-could-cut-your-life-short-94747327572.html>.
Calvin College openURL resolver

Inequality from Rich to Poor

Ashton Bucheger
Mr. Reuter
Economics -- B2
9/22/2014
Inequality From Rich to Poor

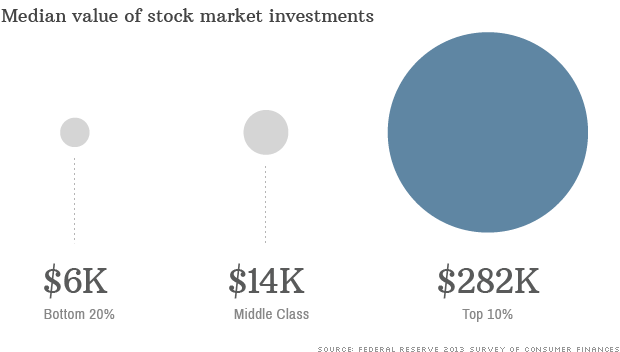
We’ve all heard about the great spread of wealth across the U.S. and how the wealth inequality, or distribution of wealth, is large between the rich and poor in America. This inequality between rich and poor has been cause for many reasons the largest of which is the marginal benefit versus marginal cost of the different economic classes. It boils down to the simple fact of the rich have more ‘liquid’ money and with the stock market as it is the more you put into it the more you get out of it or lose in it. “Putting a dollar into the popular S&P 500 index that tracks the largest companies traded on U.S. stock exchanges in March 2009 would leave you with $3 today. That's a nice 200% return, but obviously if you had invested $1 million in the market over the same time period, you would now have $3 million (Long).” The rich just have more to gain by taking the risk the market presents and being able to put more money in than the other economic ‘classes’ as shown below.


Stock market investment by the rich isn’t all bad right? When “Overall, the amount of wealth held by American households increased 14 percent between 2009 and 2011, going from $298,000 to $339,000 in inflation-adjusted dollars, the report said (What).” I mean after all, them getting richer makes the average wealth of America greater that isn’t bad is it? Just because the average wealth of American citizens does get larger as the rich get richer you have to remember where they get their money from and that that margin of inequality keeps getting larger “Yet the study also revealed that only the 13 percent of households with a networth of $500,000 or more saw their wealth increase. Every other income group in the US saw their net worth decline (What).” Even though the average American household’s income has increased only the rich get richer and everyone else gets poorer as the graph below shows.


Yet another source of inequality comes from stocks because if stocks drop in one area and you are diversified your overall status has barely dropped while if you have all your eggs in one basket and the basket tips you stand to lose allot of money. As you get lower and lower down the economic pyramid you are forced to have more and more eggs in one basket because there is no other basket to put them into. A house is one of these forced baskets and is an achilles heel to middle and lower class citizens. “The main difference between the richest Americans and other economic groups, Pew reported, is that the top 7 percent have their wealth diversified in stocks, mutual funds and other financial schemes. For the remainder of the population, household wealth is locked into the value of their homes, the sector that took the greatest hit when the bottom fell out of the US economy in late 2008 (What).” When the house market bubbled and popped the rich had the means to diversify because there wealth wasn’t all sunk into their house and was locked away in other areas of the market. They didn’t lose as much and have recovered faster because they had the ability to expand their wealth on a scale which is simply not usable for most middle and lower class americans, the stock market.

The stock market is not a problem though. The problem is the inequality. If more people were on the same playing field then the game is more equal however only a few have the means to efficiently make use of the better playing field and therefore have an advantage over the rest of the population. The richest of the rich even have an advantage over the rich on this playing field “The greatest demonstration of inequality is most evident in the income generated by not the top one percent, though, but by the sliver of the US population that makes more than 99.9 percent of the country. According to the firm’s research, the top 0.1 percent of Americans earned around $6,373,782 during that same 12-month span — or around 206 times what the average family in the US earned (Inequality).” When the rich are only “reaping in around $1,264,065 in 2012 — or around 41-times as much as the average income for all wage-earners (Inequality).”

In conclusion economic inequality in America is a major issue even if it is not known to be a totally bad or a totally good thing at this time.


Bibliography
"Inequality Gap between Super Rich and Poor Continues to Widen." ­ RT USA. N.p., n.d. Web. 21
Sept. 2014. <http://rt.com/usa/sadoff­inequality­rich­poor­685/>.

Long, Heather. "Who's Getting Rich off the Stock Market?" CNNMoney. Cable News Network, 18
Sept. 2014. Web. 21 Sept. 2014.
<http://money.cnn.com/2014/09/18/investing/stock­market­investors­get­rich/index.html?iid=HP
_River>.

"What Recovery? US Rich Get Richer, Middleclass Treading Water." ­ RT USA. N.p., 24 Apr. 2013.
Web. 21 Sept. 2014. <http://rt.com/usa/us­financial­crisis­wealth­occupy­wall­street­307/>.

Photography

Madison Schaefer
Economics B4
Mr. Jim Reuter
23 September 2014
Photography
An evil villain once said, “When everyone’s super, no [can] be” (Incredibles). What he meant is that if everyone has the “super camera” then it no longer because super, but, in fact, standard. It seems as though it has come true about the evolution of photography.
Photography is becoming a booming skill in a culture with a plethora of technology. When Louis Daguerre and Joseph Nicéphore Niépce invented the first camera, I doubt they could have imagined what it would become. Scarcity is no longer an issue when it comes to digital cameras. There are so many different ways to to take a digital picture, for example there are phones, laptops, desktops, DSLR cameras, point-and-shoot cameras, and so many more. However, even though the are many different ways for people to get their hands on a camera, there is still a product that dominates the world of photographers. Not everyone can afford a DSLR and the trade off for the purchase for a smartphone is much less significant than the trade off for the purchase of a DSLR.
Looking at the graph, it might help to understand that the first generation iphone came out in 2007, which then boosted the sale of smart phones for the following years. The positive slope of the smartphone data is fairly consistent, which is a notable observation. The DSLR cameras were not necessarily not as fascinating at this time, just more expensive, and advertized less. So, households continued to look for the compact phone cameras as an alternative to DSLR cameras, causing the production possibilities curve to shift to producing more multipurpose phones than cameras. The reason for the shift is not there is a higher demand, but that there is more space and technology to mass produce phones when compared to mass producing cameras.
The use of cameras has changed, thus the necessary equipment to take a photo has changed. No longer is photography regarded as an expensive art, but something that can include a multitude of ugly “selfies” and a way to capture every child’s first and funny moments. It’s understandable, not everyone has a ton of money to spend on a DSLR or even a point-and-shoot camera, and as the prices for these have gone up, the price of smartphones has gone down, from the perspective that a person can get more for their money. Phone cameras are more convenient, and already go with people wherever they go. This private good has become a hit and now camera companies are not doing well. Many people don’t invest their money into a nicer camera because to them the marginal cost does not out-weigh the marginal benefit. The benefit of the convenient smartphone camera is far more important than the quality and special capabilities of a DSLR camera. This changes what classifies as photography. Filters on phone cameras and social media can alter a picture to look better than a raw picture from a DSLR.
With that said, do pictures we see on social media change how we view photography as a whole? You decide.


Work Citied


Friday, September 19, 2014

Sea World

Lauren Powell
Sea World

Sea world, a place most known for its positive and exciting atmosphere filled with animal shows and exhibits, has lost that reputation rather quickly. For those of you that haven’t seen the documentary Black Fish, I highly recommend watching it. It documents the cruel actions taken by Seaworld to capture, contain, and house their whale friends.  Sea world has done wonders for San diego's economy bringing in tourists looking for a fun get away, but since Blackfish, Sea Worlds standings have crumbled.
Blackfish Is a documentary that focuses on the captivity of Tilikum, one of Seaworld's Orcas.   The coverage of Tilikum includes his capture in 1983 off the coast of Iceland, and the stories of the three deaths he’s responsible for. It shows the horrible truths behind Sea World and how traumatic captivity truly is for these poor animals.
Before the Documentary was released in 2013, Seaworld had an average of about 24.4 million guests a year. Since 2013,the count has dropped to 23.4 million customers. It may not seem like a large drop but thats a whole one million customers. If you divide 1,000,000 by 4 (the average family size of America), that’s 250,000 less hotel rooms being booked, cars airplane tickets being bought, and reservations being made in the city of San diego, there for having a negative impact on their economy.
Not only has Seaworld's income dropped but their stocks have as well.  Records show that the day Seaworld announced it’s quarter earnings, following the documentary, their stock dropped 2.66 percent that day.  Following that week, a bill was proposed in California stating that Orca shows should be outlawed at all Seaworld's and zoos. The week following the proposed bill, stocks dropped another 7%.  As of July of 2014, Seaworld's stock has officially dropped 25% from it’s highest point in time.  
Although there is no denying that the recent drops in attendance and cost have come from the documentary and truths revealed, the company has tried to convince America otherwise by blaming it on “bad weather” and other non realistic theories.  This has also presented the company with a decision regarding opportunity cost. Do they spend more money, money they are already losing to convince the public that everything Blackfish has said is lies, or do they just let it go and lose customers. They chose to release statements calling the documentary “shamefully dishonest” and “nothing but lies”.  Seaworld has also made sure, through the use of advertisements and newspaper, to make it clear that everything that has been released are “inaccurate reports” while reiterating their beliefs in their Orca’s well being. Although they have given a clear and hard effort by investing in larger whale tanks and housing conditions, there is no denying the fact that Seaworld is starting to crumble and will for sure be a loss for San diego's economy.
For years Seaworld has been one of the number one tourist attractions in San diego but all that is beginning to change.  All the money that San Diego’s economy benefited off of the tourists buying hotel rooms, and dinner, is all about to turn to dust. Due to declining customers and stock, Seaworld's positive reputation is slowly beginning to fade. If you have not watched Blackfish, take a look and decide for yourself if you think the treatment of the Orcas is fair or not.


." CNNMoney. Cable News Network, 13 Aug. 2014. Web. 15 Sept. 2014. <http://money.cnn.com/2014/08/13/investing/seaworld-earnings/index.html>.

"SeaWorld Stock Drops." Norbert Haupt. N.p., n.d. Web. 15 Sept. 2014. <http://norberthaupt.com/2014/01/02/sea-world-stock-drops/>.

iCraze

Alyssa Meka
Mr. Jim Reuter
Economics
16 September 2014

iCraze
Whether we like it or not, the current generation consists of a flurry of typers, tappers, and swipers who are intrigued with, more than anything, their electronic devices. From smartphones to tablets to wearable fitness devices, the gadgets that entrance us are bending the limits of technology, as well as the barriers of our budgets. But how far will companies stretch to introduce “the new thing”, and just how much is one person willing to pay for it?

It seems the answers to these two questions are exactly the same- limitless. Take the Apple company for example. Since the production of the first iPhone, they have introduced ten different versions of the phone. For each of these new versions, Apple has claimed to have added different assets and/or improved features. As these features have accumulated, the price has too. One source claims that “phones account for more than half of Apple’s total sales” and says that in the past year alone, Apple “has sold more than 163 million of them” (“iNeed?” Time Magazine). With production costs of these phones ranging from about 170 to 220 dollars, the company is definitely profiting from phones that are bought without a contract “rang[ing] in price from $649 to $849” (“Here’s How Much it Costs Apple to Build New iPhones” CNBC). This profit only helps the company to further advance and refine their product and make it cater to our every need, even if we weren’t previously aware of certain needs the producers at Apple are addressing.

This is exactly part of the draw of Apple products and the similar products of other tech companies. It is stated that the advertisement and portrayal of the gadgets “takes products we never wanted and convinces us we can’t live without them” (“iNeed?” Time Magazine). Take this recent ad  for example. It stresses that the iPhone can help us achieve our wildest dreams. Even so, companies like Apple often dance around the idea of a new product when introducing the hottest new commodity. It is apparent that companies like Apple are skilled in the art of refinement, taking what has previously not passed the test of the market and mastering it to make it useable. Could it be only their advertisements making it seem like we need their products? Or is it also the draw of anticipating a new product that keeps so many people loyal to the company? Here is a compilation of most of the products to this date.

Whatever it is, it seems that Apple has literally struck the gold mine (really, they have a gold iPhone) with their products over the past years. Just look at this dotplot of their sales from 1990 to 2011.  


That’s one heck of a steep increase! With the release of their new products soon, the much anticipated iPhone 6 and Apple Watch, these sales can only increase.

Aside from the fact that Apple has had the ability to increase their sales by billions throughout the years, they have also been able to multiply the amount of returning customers they have. By creating products that cater to the needs we have to stay organized and connected, Apple has been able to generate millions who both want and love the products because of the many capabilities they have. Despite the high costs, Apple has been able to create quality products that offer benefits many customers find far outweighing the pains to their bank account. Do you think it’s worth it?


Works Cited
Adhikari, Richard. "Apple's New IPhones: Ho-Hum and Controversial Too." TechNewsWorld: All Tech. N.p., 11 Sept. 2014. Web. 15 Sept. 2014. <http://www.technewsworld.com/story/81031.html>.
"Apple - IPhone 5s - Dreams." YouTube. YouTube, n.d. Web. 15 Sept. 2014. <https://www.youtube.com/watch?v=PQBTd4xF6tU>.
"Evolution of Apple." YouTube. YouTube, n.d. Web. 15 Sept. 2014. <https://www.youtube.com/watch?v=KvdVhl4FlEc>.
Goldman, David. "Apple's Financial Empire." CNNMoney. Cable News Network, 25 Aug. 2011. Web. 15 Sept. 2014. <http://money.cnn.com/galleries/2011/technology/1101/gallery.apple_sales/>.
Grossman, Lev, and Matt Vella/Cupertino. "INeed?" TIME 22 Sept. 2014: 40-47. Print.
Thompson, Cadie. "Here's How Much It Cost Apple to Build New IPhones." CNBC. N.p., 24 Sept. 2013. Web. 15 Sept. 2014. <http://www.cnbc.com/id/101058725#.>.


Wednesday, September 17, 2014

Tori Matkin
Mrs. Straub
Economics - B3
10 September 2014
Grab Your Guns, Ladies!
I personally have shot my dad’s 45 gauge handgun and have shot clays with a shotgun at the Milford Hills Hunt Club. Whenever I walk into the Milford Hills gun shop, I always see the little pink purse guns for girls. But women haven’t always been interested in guns. Back in the day, it was the stereotypical American white male who owned the guns because of the fact that it was thought of as a man’s sport and a “defense of the home” as a man’s responsibility. But the game has changed, and women are becoming more interested in gun ownership.

“Recent research by National Sporting Goods Association shows that number of women gun owners in the United States has jumped from 13 percent in 2003 to 23 percent [in 2011]” (Sukow). This increase in number is most likely due to women wanting a weapon to be able to defend themselves. And, of course, a gun is an optimal choice. Kirsten C. Tynan, who describes herself as a “pro-self defense feminist,” added in an email: Whether I am in a high crime area, car camping alone on a road trip, or hiking solo in bear country, carrying a firearm gives me another tool to ensure my own safety without having to depend on someone else. It opens up more opportunities for me because I don’t feel I have to have a partner by my side for my protection (Ritz). Protection is a self-interest for women. The women that enjoy the feeling they get knowing that they don’t need anyone there because they’re packing, gives them a sense of courage and they gain confidence.

But why now? It obviously makes sense that due to the increased number of independent women, that they are more interested in owning a gun, but the number of female shooters has significantly increased. And with that, more firearms are being produced.


All told, the firearms industry contributes more than $33 billion to the U.S. economy and supports about 220,000 jobs, according to the National Shooting Sports Foundation (Hall). The economy has grown with innovation trying to focus on the new female demographic: “gun manufacturers are trying to find the angle in their product line that will turn a predominantly male-focused industry toward females with options so far including smaller sizes, color options, and elements that reduce user fatigue” (Ritz). Gun manufacturers are thinking at the margin on this one, and it was the right move.
The economic value created by the firearms industry also is increasing steadily, from $19.2 billion in 2008 to $27.6 billion in 2010 and reaching a record $33 billion last year, according to NSSF calculations based on wages and salaries (Hall). All of this meaning that more firearms are being produced - especially in the United States. The 25-year survey estimated that 2,228 U.S. companies produced more than 106 million firearms from 1986-2010 (Hall).
So even though gun ownership will most likely always be a debate, it has become a significant benefit towards society: jobs have been created, the economy has grown with innovation, ...and self confidence in women is always a plus.


Works Cited

Hall, Glen. The ATF. The Blaze. Web. 10 Sept. 2014.

Hall, Glen. “The Gun Industry Employs Twice as Many Americans as GM.” The Blaze. Tactical Firearms Training Secrets, 26 Mar. 2013. Web. 10 Sept. 2014. <http://www.theblaze.com/stories/2013/03/26/nr-draft-how-important-are-guns-to-the-u-s-economy-for-starters-the-firearms-industry-employs-twice-as-many-americans-as-bailed-out-gm/>

Ritz, Erica. "Women and Guns: Why Female Gun Ownership Is Rising and Why Many Are Taking Notice." The Blaze. Tactical Firearms Training Secrets, 9 Apr. 2013. Web. 10 Sept. 2014. <http://www.theblaze.com/stories/2013/04/09/more-and-more-women-are-buying-guns-heres-why/>.

Sukow, Jill. “Ladies...Grab Your Guns!” Milford Hills Sept. 2014: n. pag. Print.

“Women Defying Gun Owner Stereotype.” Guns in America. NBCUniversal. MSNBC, New York City. 16 Feb. 2013. Web.

Behind the Scenes-2014 MLB Trade

Jessica Sklenar
Mrs. Straub
Economics A3
14 September 2014
Behind the Scenes-2014 MLB Trade
The 2014 Major League Baseball (MLB) trade is truly one that will go down in history. In the months prior to the 2014 trade officials decided to move the trade deadline up to July 31st, 2014. By doing so the MLB created the perfect economic conditions and a sufficient understanding of realistic trade based on the new two wild card format. The new two wild card format establishes a new one-game, wild card round in each league between non division winning teams with the best records, meaning a third place team could win the World Series . In the end the success of a team all comes down to the supply and demand of players
As the trade deadline grows nearer the representatives of teams begin to adjust to the possibility of trading players that could help them reach the playoffs. Upon reaching the trade deadline eight of the American and National League teams have a fifteen percent of reaching the playoffs; however nine teams have absolutely no chance of making the playoffs. Now due to the fact that there are nine teams with a zero percent chance of making the playoffs, supply of players will decrease while demand of players will increase as teams try to improve their chances of reaching the playoffs by investing in the trade. After all because the tension is rising with the addition of the two wild-card format teams need to make sure they have the best roster possible if said teams want to make it to the playoffs; let alone win the World Series.
The chart below shows how the supply (blue line) and demand (red line) for players eligible for trade as of July 2014. The equilibrium point represents where the price is set by the market with the supply of players meeting demand for the amount of players located at Quantity 1 and Price 1.
Based on the fact that the sixteen teams with a fifteen percent chance of reaching the playoffs would be less likely to participate in the trade than the nine teams with a zero percent chance of reaching the playoffs, the supply of players would typically decrease. Due to this decrease in supply of players and rising demand of trade, the price of trading players would in turn increase and profit margins would increase as well.
For example when the Oakland Athletics traded Addison Russel for Billy McKinney and Dan Starily for Jeff Samardzija and Jason Hammel, other teams began to take notice and look for ways to improve their chances of reaching the playoffs by participating in the trade. However in comparison to what can be inferred based on the graph above, as demand increased; supply decreased, the cost of trade increased as well; teams that were not at first considering trade are almost forced into the process.
Much like the invisible hand the MLB trade is affected by all surrounding factors: the performance of players, competing teams, supply, demand, profit margins and trade expenses. But in the end, if there are not enough players drafted to fill the demands of teams, the draft can be nearly impossible depending on the trades made by competing teams. Thus based on the evidence provided the statement rings true that the entire MLB draft is overall dependant on the supply and demand of drafted players.

Works Cited
"Why the 2014 MLB trade deadline was so crazy." Beyond the Box Score. N.p., n.d. Web. 15 Sept. 2014. <http://www.beyondtheboxscore.com/2014/8/1/5959053/2014-mlb-trade-deadline-crazy-lester-price-cespedes>.
services, ESPN.com. "MLB, union agree to expand playoffs." ESPN. ESPN Internet Ventures, 2 Mar. 2012. Web. 15 Sept. 2014. <http://espn.go.com/mlb/story/_/id/7638357/mlb-expand-playoffs-two-teams-10>.

Related Posts Plugin for WordPress, Blogger...